Analyzing Incident Data for Over 400 Sites During the AWS Lambda Outage

Yesterday, AWS US East 1 region was impacted by a Lambda outage, affecting everyone directly or indirectly built on top of AWS Lambda (including Vercel & Netlify Serverless).
I was curious to see what the blast radius for this incident would be - given the number of services I saw go down in the afternoon. Not to mention, it’d shed some light into how dependent we are on serverless infra, and how sites report widespread outages.
Methodology
I downloaded the incident history of 480 sites that I found using StatusPage.io (opens in a new tab) (which has a handy JSON API) and parsed out the incidents for each domain which yielded 20,000 incidents (most un-related to the AWS outage).
Determining if the incident was directly related to AWS was tricky, since many sites did not provide in-depth details in their incident report. Therefore, I focused on broader trends during the 2 hour incident window, with the caveat that not all incidents can be attributed to the AWS outage.
I only sampled sites using StatusPage.io (opens in a new tab), so there's an inherent bias towards relatively mature B2B SaaS companies and can’t really be used to extrapolate to the rest of the internet.
Lastly, the purpose of this analysis is to identify interesting trends on the impact of a widespread outage, rather than to name and shame any particular set of companies. It's fortunate that many companies provide easy access to their uptime transparency data!
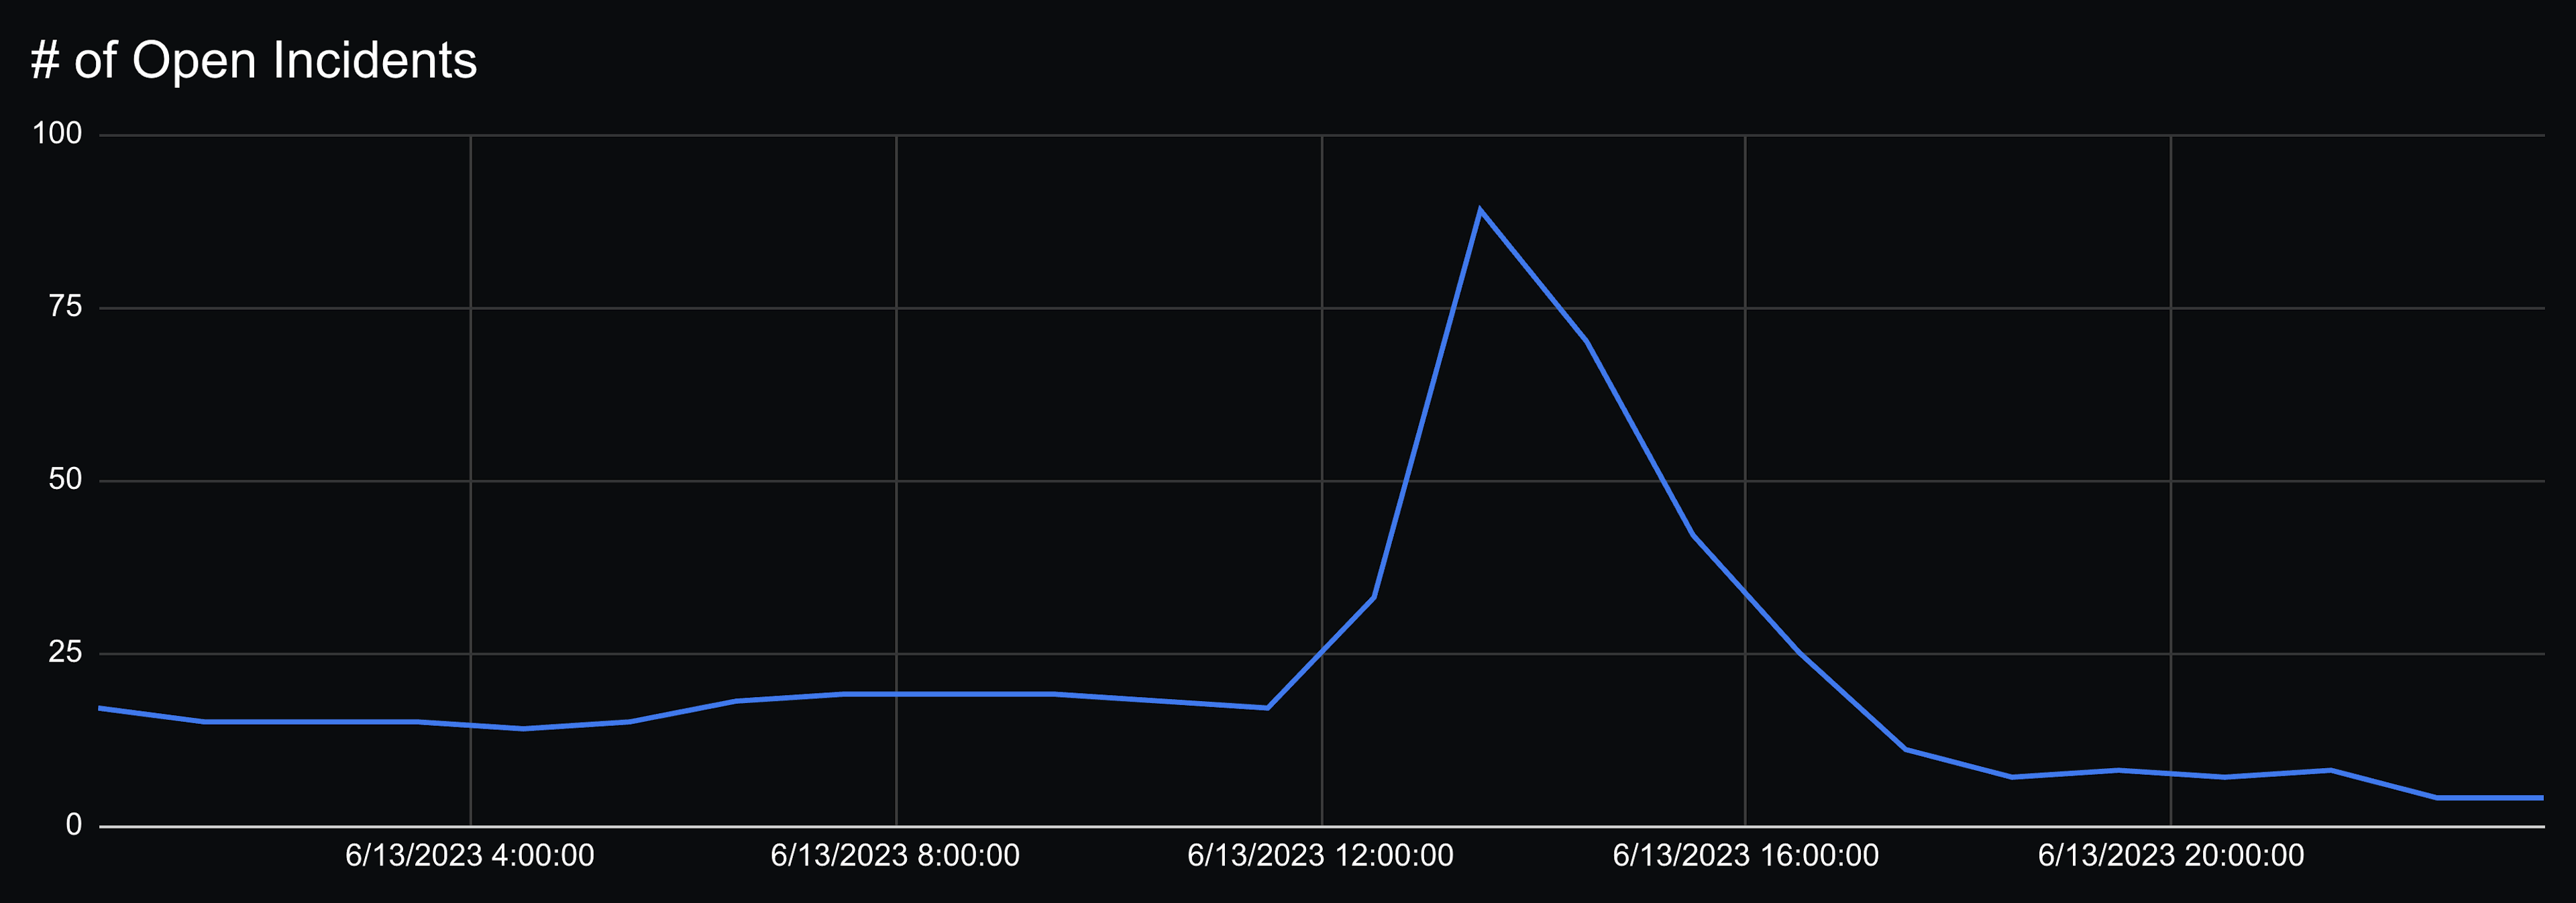
How Many Sites Were Impacted
At the peak, 89 sites had an incident open out of 480 sites we have data for. Pre-incident there were 17 sites with incidents open, which meant that we can estimate 72 sites were impacted by the AWS outage, which is 15% of the sites we looked at. (Compared to ~30% of sites impacted in the Winter 2021 AWS outages)
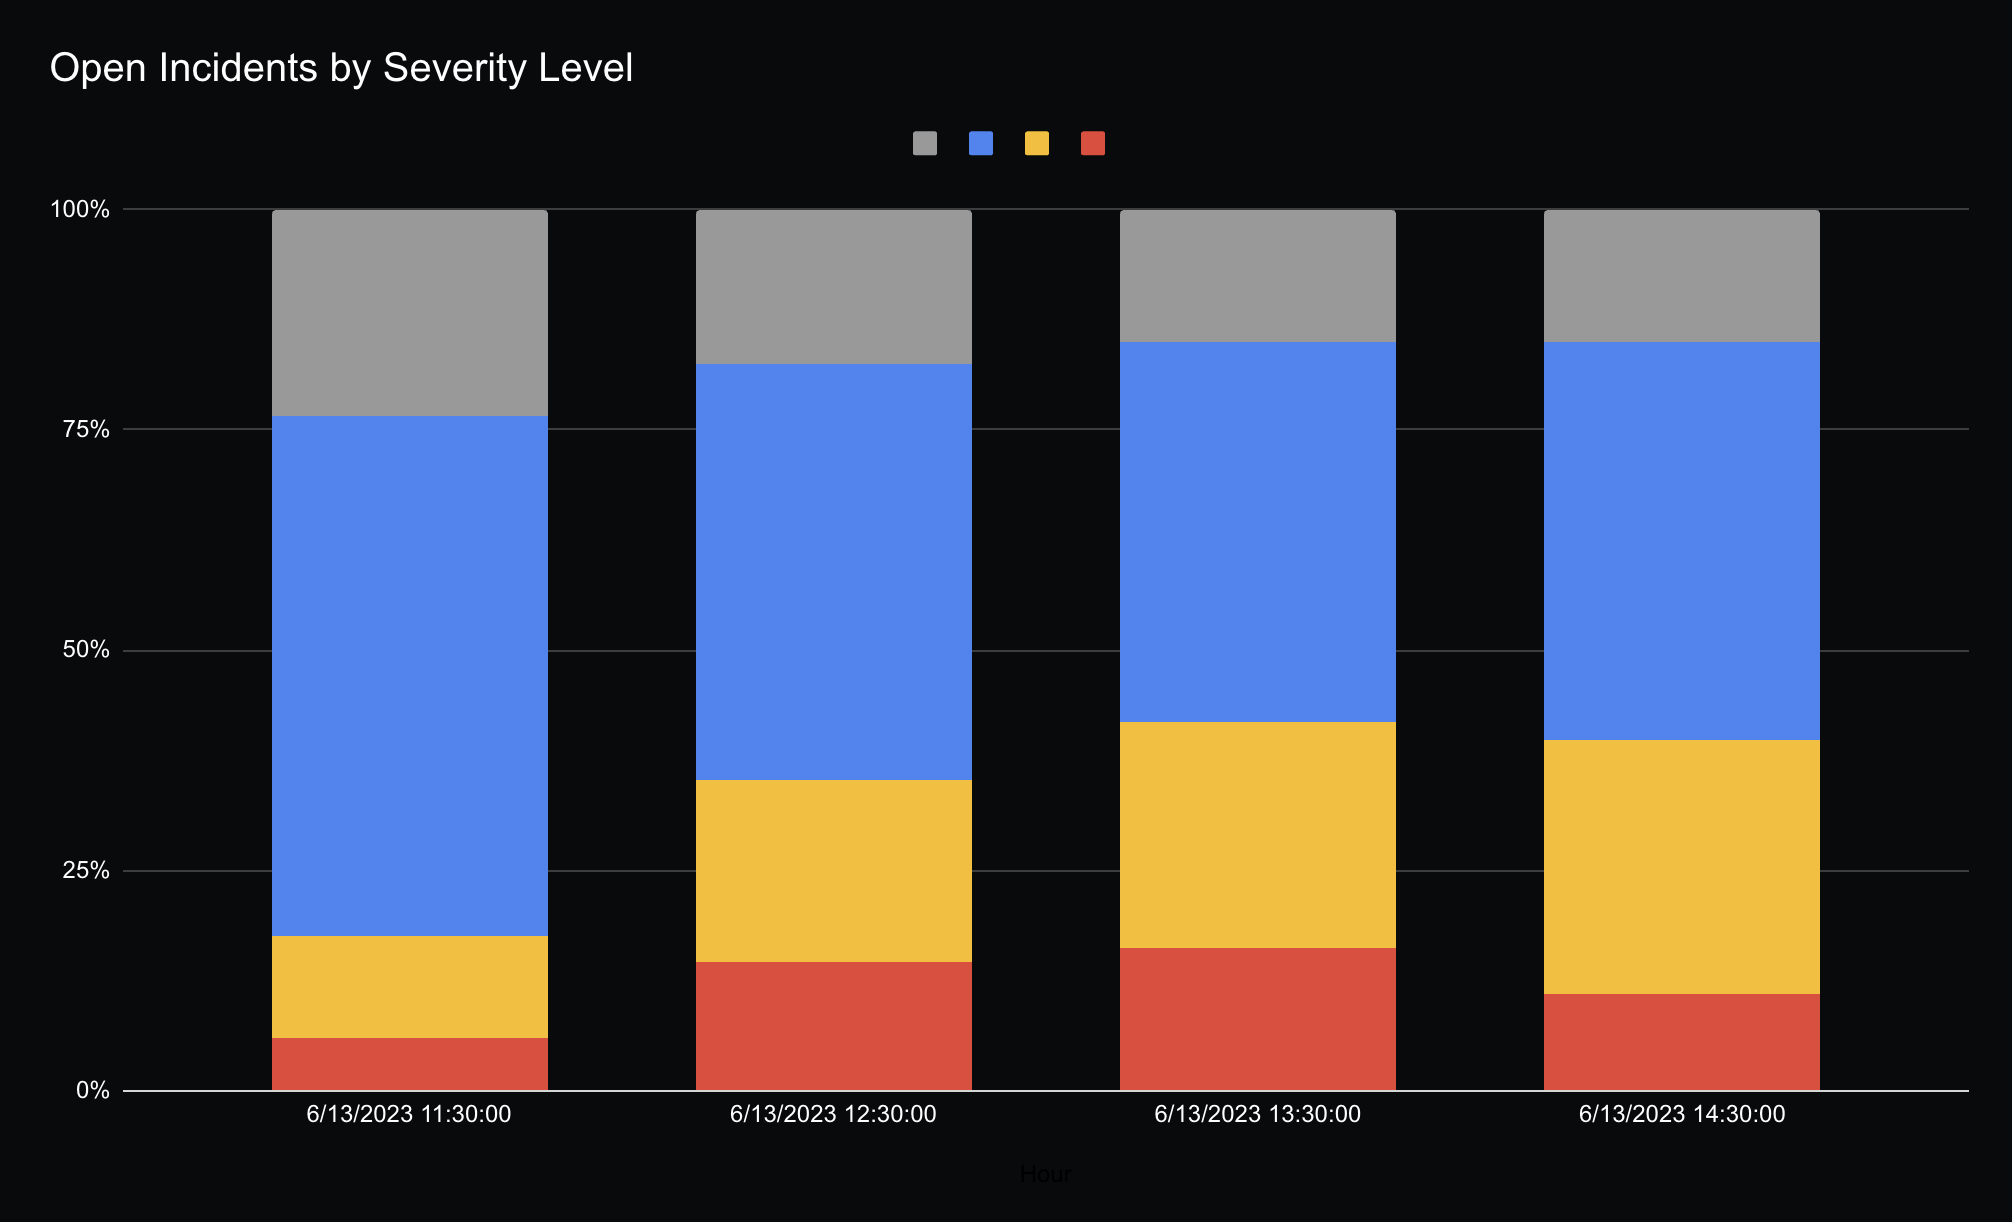
StatusPage also allows websites to label incidents by severity, about half the sites labeled the incident as minor, while the other half labeled it as major or critical. Extrapolating from this, roughly half of the lambda user base isn’t using lambdas for business critical functionality.
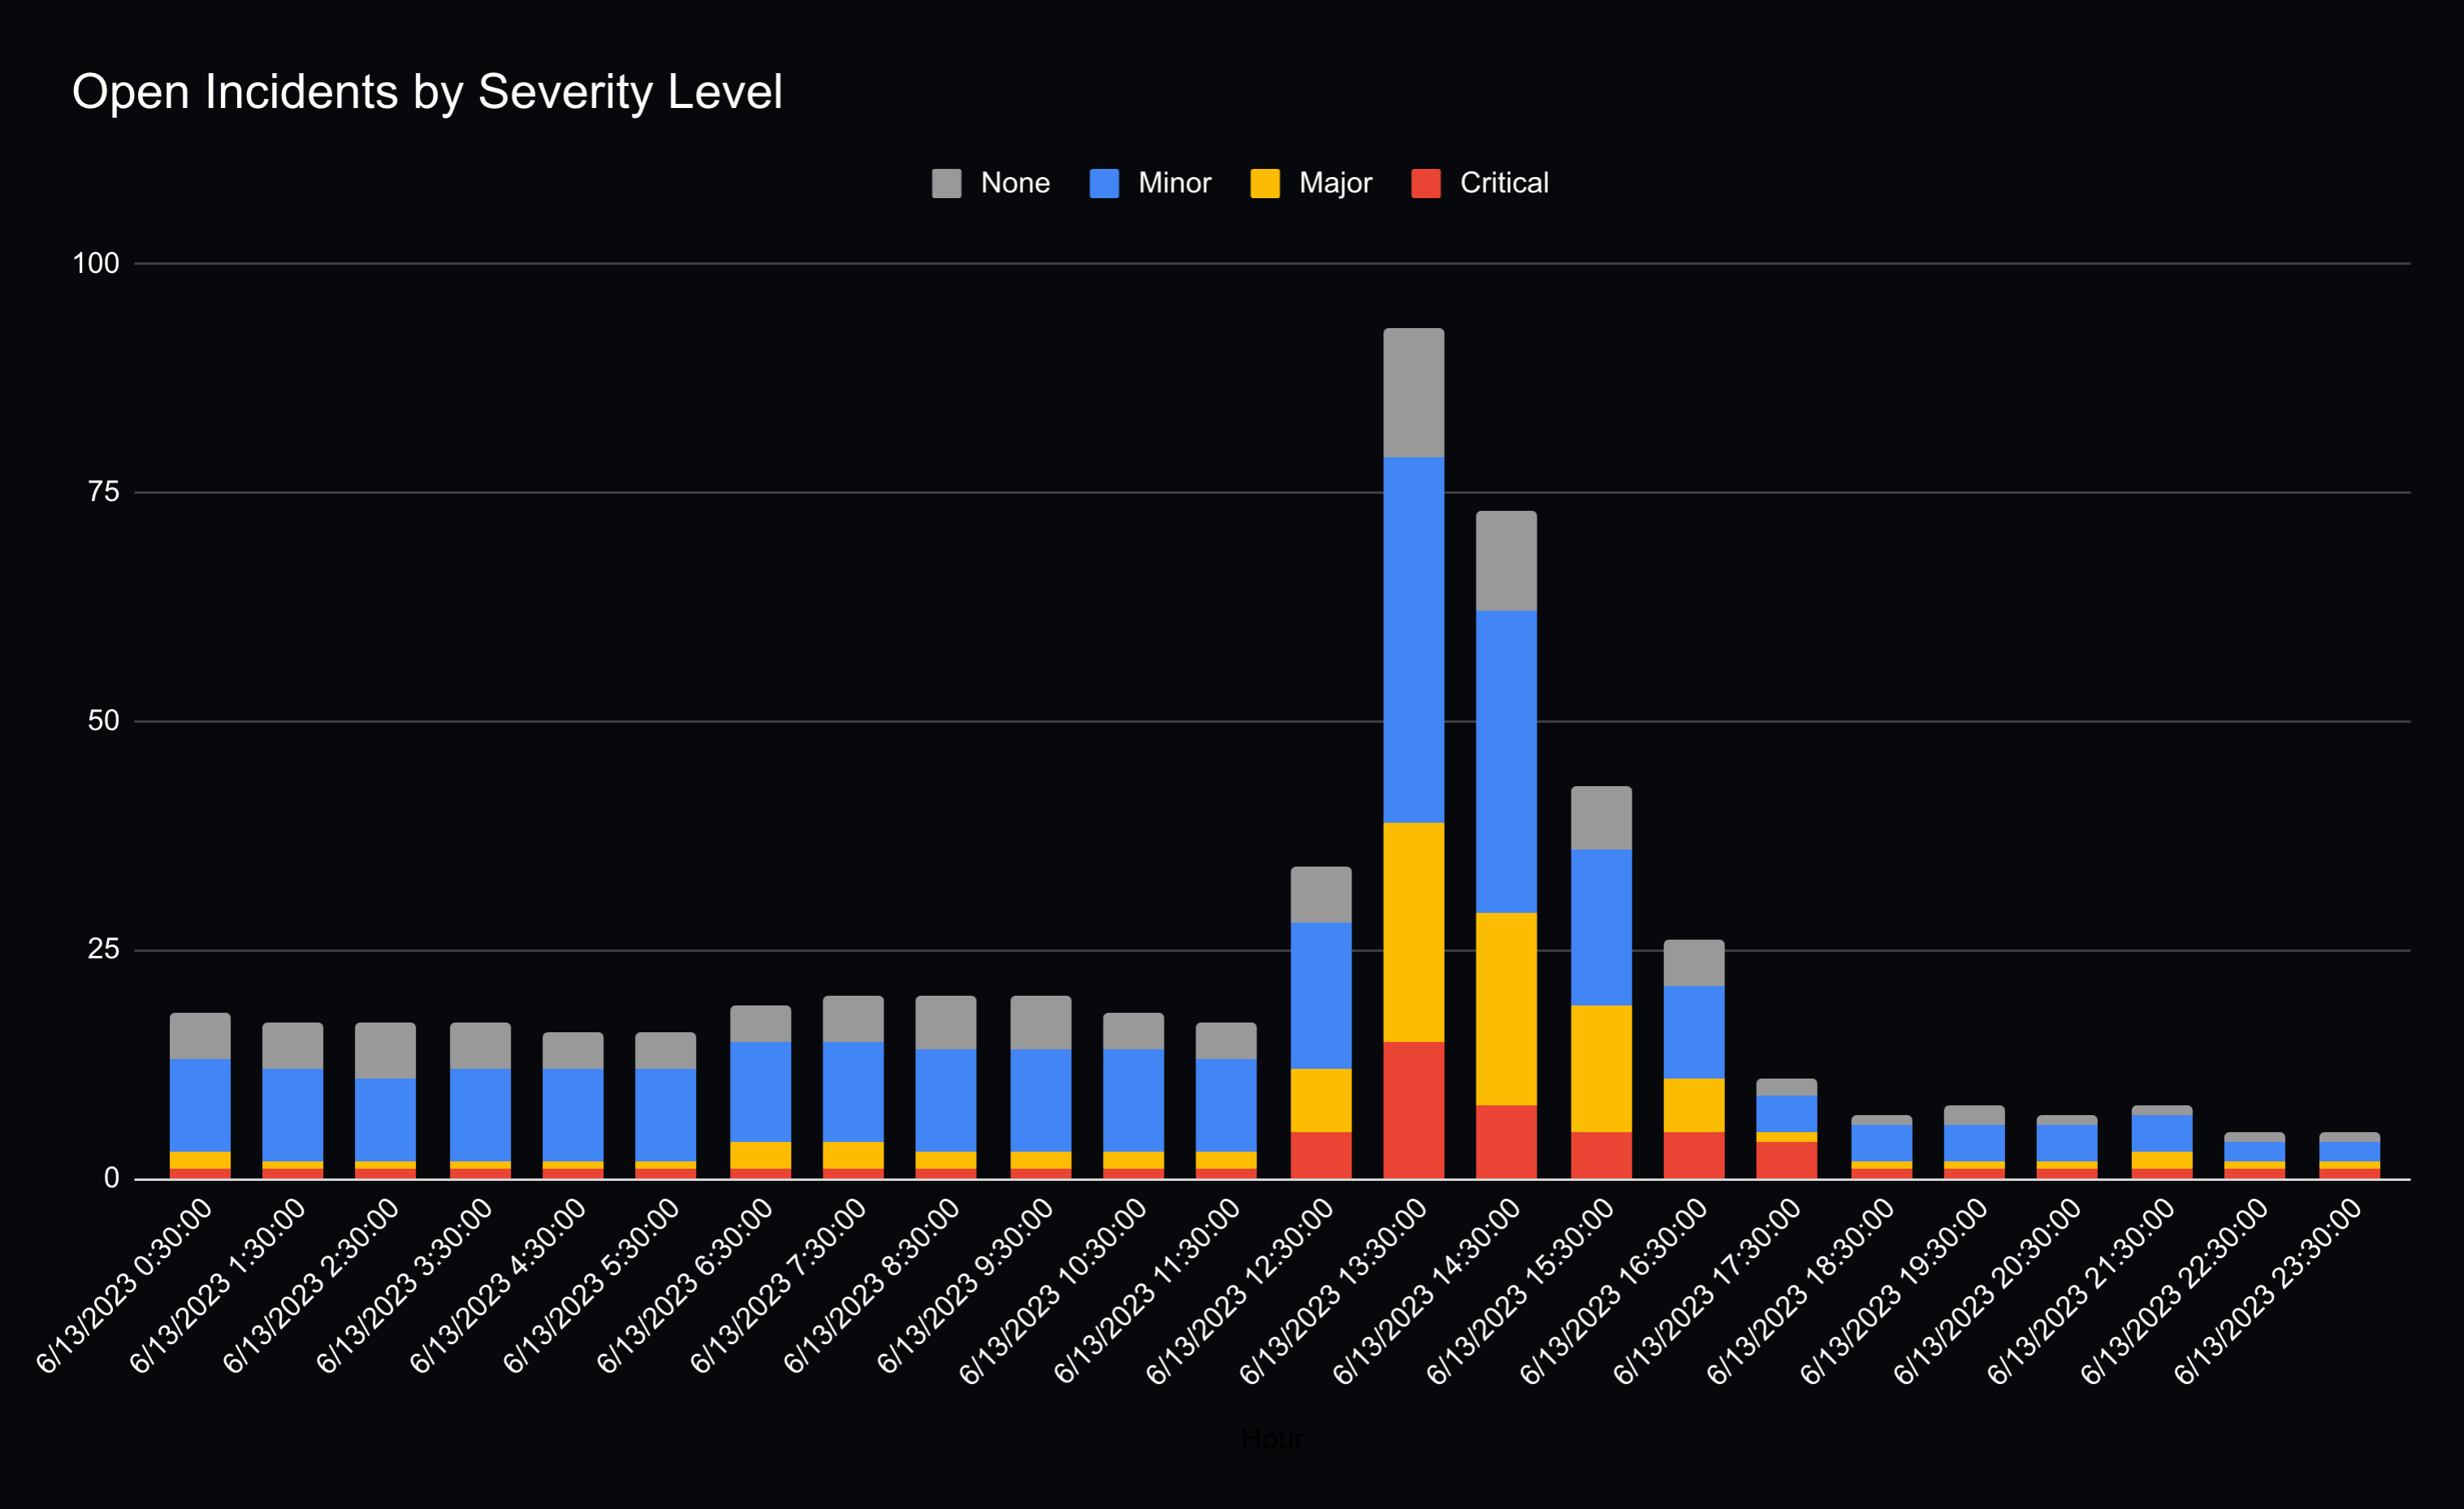
Interestingly, the ratio of severity levels between incidents was relatively constant throughout the whole incident. I’m assuming this likely meant sites who had critical/major impact, did not resolve the incident any faster than sites that had minor impact. Likely, the majority of sites were not able to mitigate the impact before AWS recovered.
How Quickly Did Sites Notice
Now that we know a bit more about the blast radius, I was curious how fast were sites able to detect their own outage as part of their incident response process. I personally noticed the outage when we got alerts from HyperDX about Vercel error logs showing that our functions were failing to execute (which were luckily non-critical to our site).
It was also interesting to me that many people (including the team at Vercel) noticed AWS’s outage well before they reported it on their own status page. While public status page updates are not a precise measure of mean time to detection, I figured it can still show an interesting picture of how fast are companies able to communicate an incident status publicly.
I’ve graphed how many new incidents were opened over time, and roughly shaded incidents opened during the AWS incident window in red for clarity.
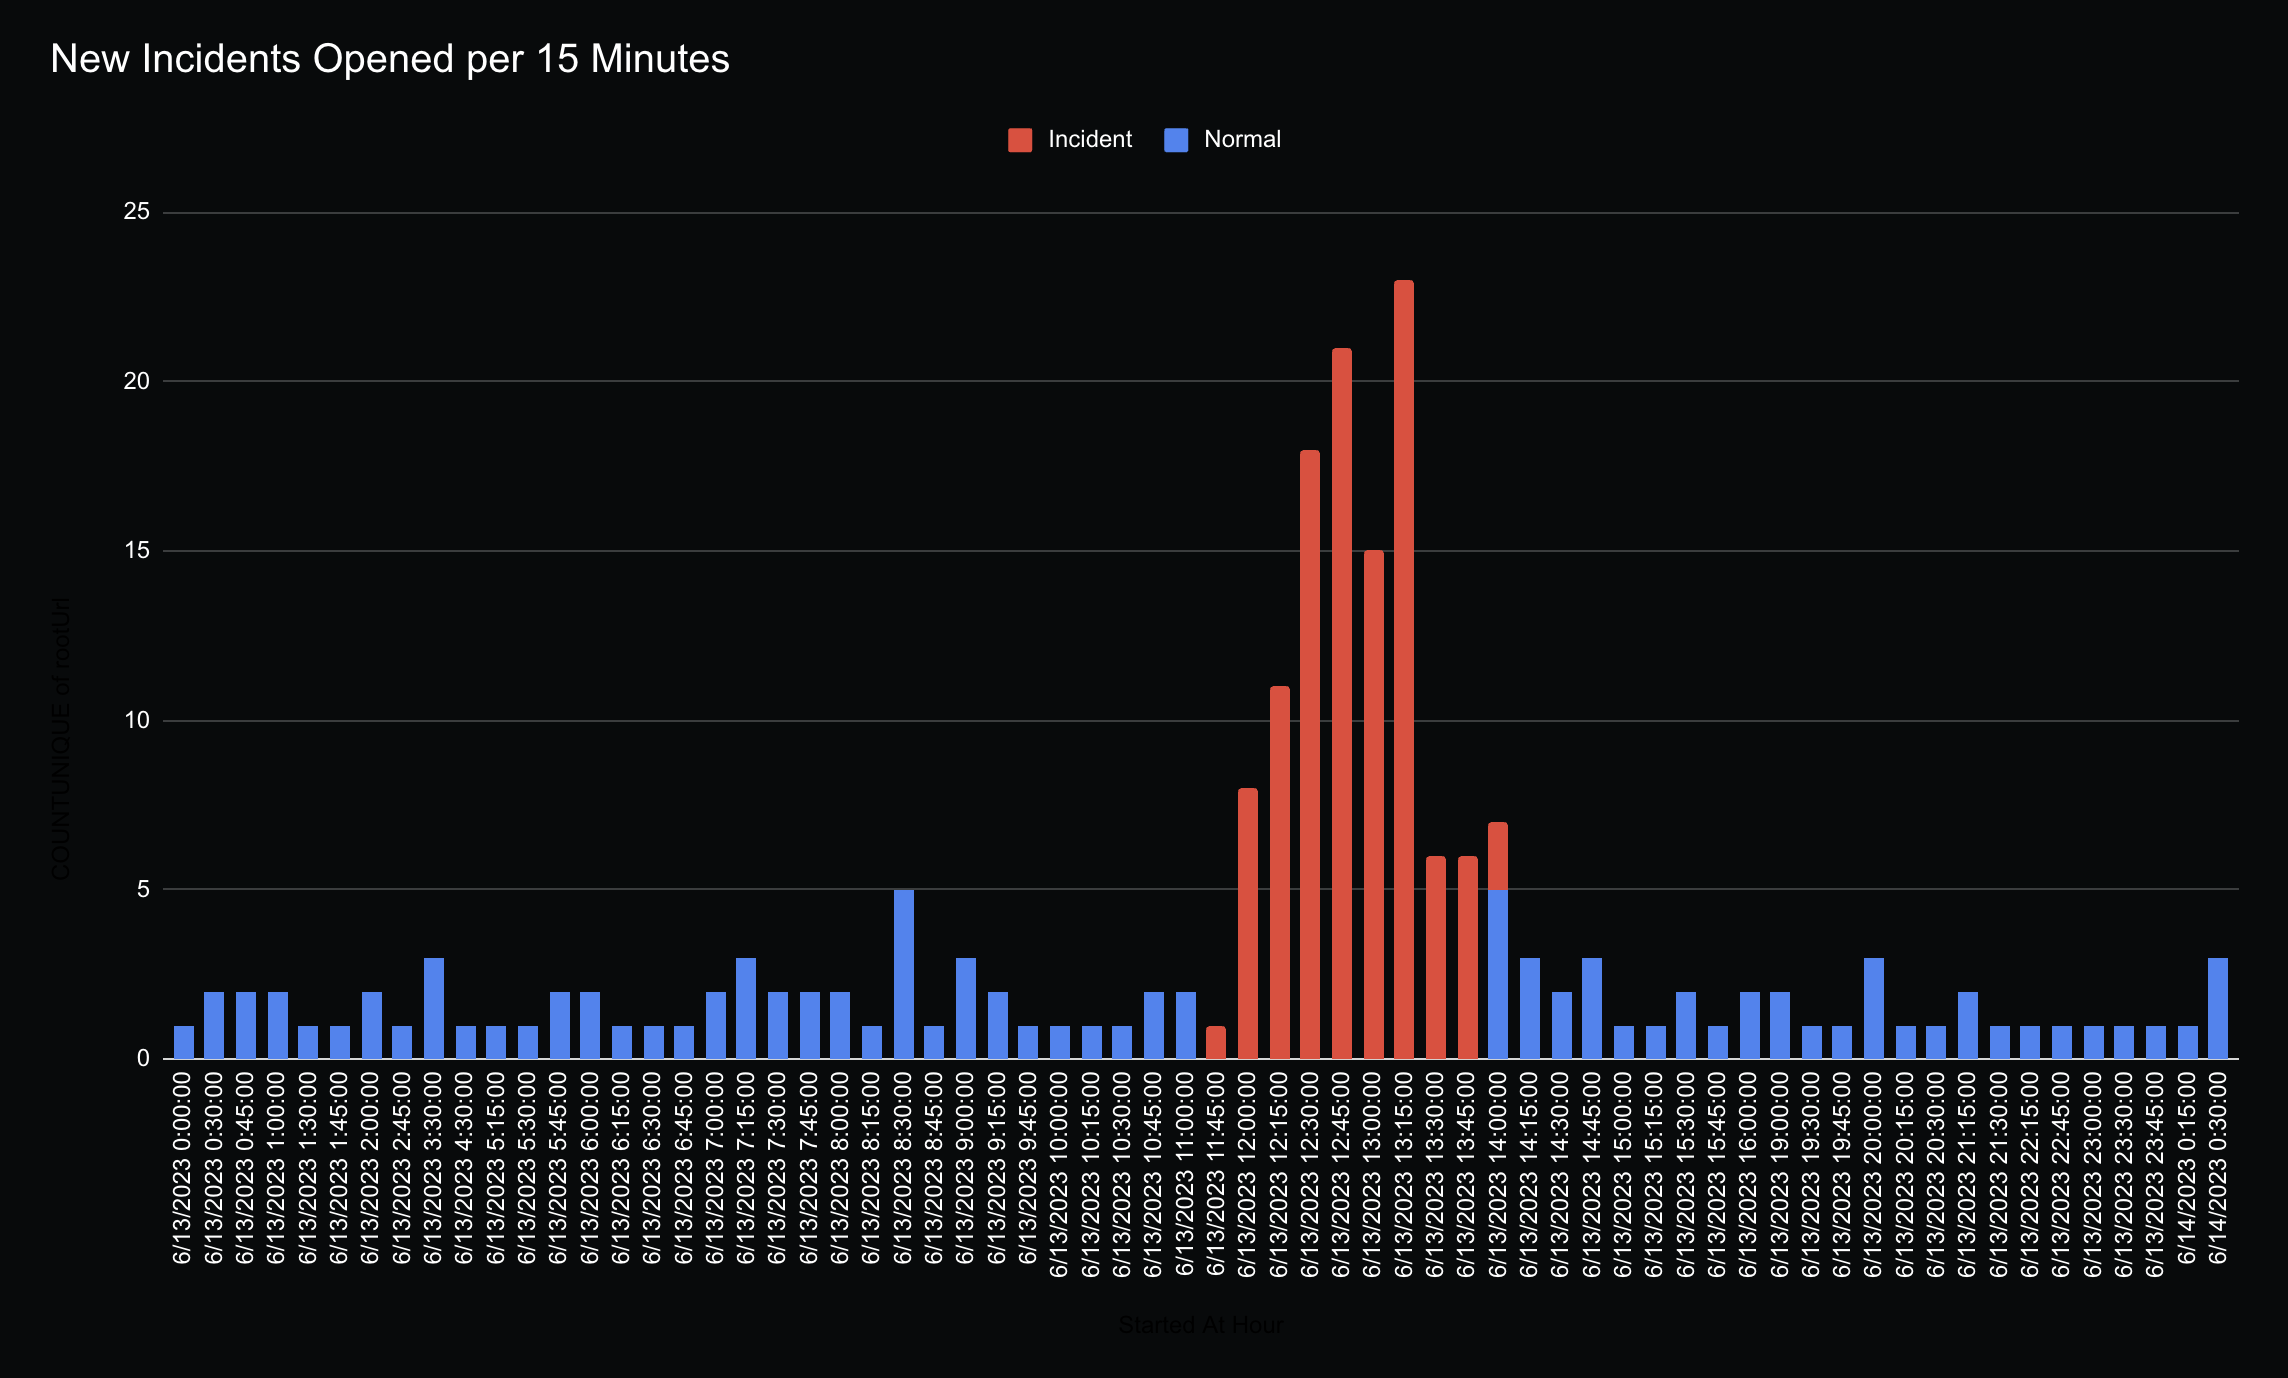
We can see only a minority of companies were able to notify publicly within the first minutes of the incident, with only 9% of impacted sites reporting within 10 minutes and 21% within 25 minutes. What’s interesting to me is that slightly less than half the sites did not report the incident until 1 hour after the AWS outage began.
It’s impossible to accurately attribute why some sites delayed notification for so long, it’s possible it was due to internal SLA thresholds, non-prioritization of updating the status page, or lacking in observability tooling and requiring someone to notice the outage before reporting it.
Takeaways
I was personally surprised to see that a single region outage of AWS Lambdas impacted 15% of the sites I had data for, which is higher than I’d expect. Interestingly, only half the impacted sites seemed to rely on it for business-critical functionality, with half the impacted sites reporting only a minor incident.
I was also surprised at how slow many websites were in communicating the impact of this outage to their own customers, with 47% of the impacted sites taking over an hour to report an incident.
A brief plug for HyperDX (opens in a new tab): If you're interested in getting alerted when your site goes down and quickly uncovering the root cause - HyperDX makes it incredibly easy to leverage logs, metrics, traces and user sessions to solve production outages at 1/9th the cost of products like Datadog.
If you have follow up questions/thoughts - or just want to chat about monitoring & observability, drop me a message at mike@hyperdx.io.