12 Best Datadog Alternatives to Consider in 2025
Introduction
Datadog is a popular observability platform known for monitoring various aspects like infrastructure, application performance, logs, and frontend applications. Its centralized data approach is user-friendly, but the complex pricing model, including per-instance and data volume charges, often makes it cost-prohibitive for users. Moreover, Datadog's proprietary SaaS and instrumentation libraries raise lock-in concerns.
Exploring alternatives? Here's a breakdown of the 12 best Datadog alternatives, their suitability for different teams, and respective pros and cons.
Evaluation Tip: If you're looking to evaluate multiple vendors at once, try instrumenting via the OpenTelemetry standard to avoid vendor lock in and easily export or switch across multiple providers.
HyperDX
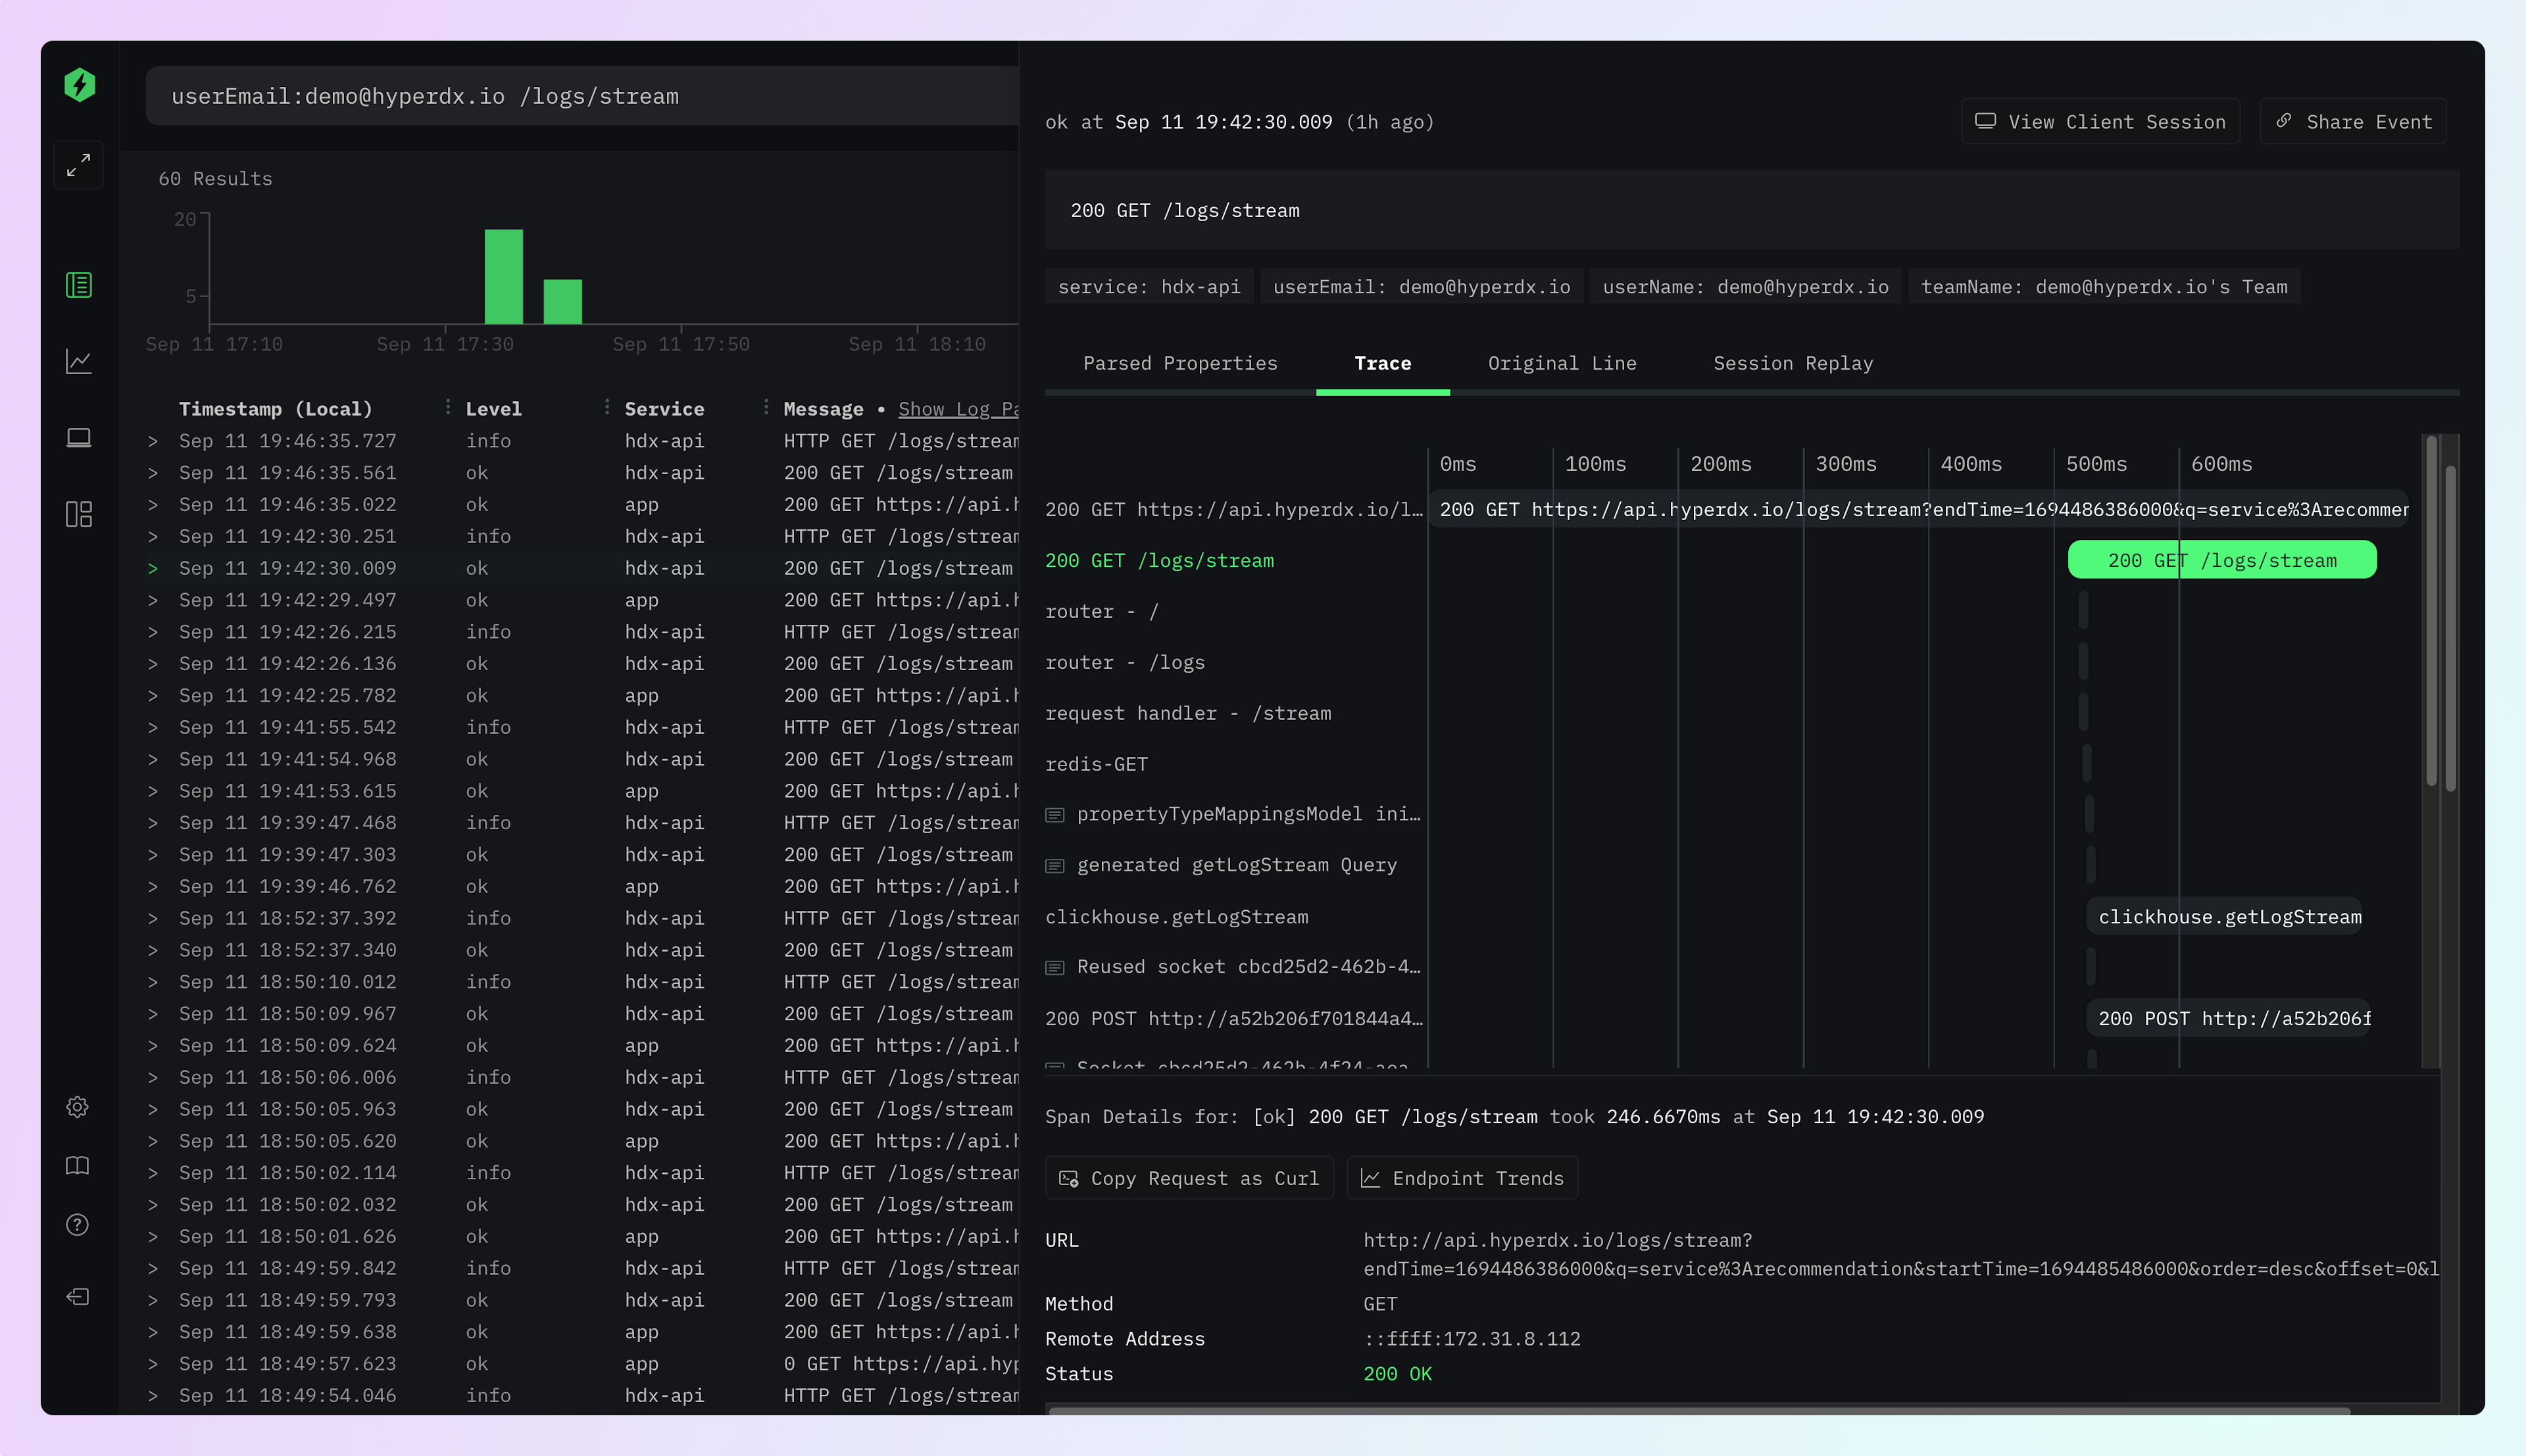
HyperDX, an open-source observability platform, utilizes OpenTelemetry for instrumentation, offering comprehensive insights into stack issues. It seamlessly integrates and correlates data from frontend session recording, API calls, backend logs, and performance, even across async message queues like Kafka.
With native OpenTelemetry ingestion, HyperDX simplifies instrumenting through batteries-included SDKs, enabling quick setup in just a few lines of code. Once data is ingested, users can effortlessly create alerts for email/Slack/PagerDuty, analyze event patterns, generate dashboards, and trace errors across the entire stack in a unified context.
Good For: Teams that frequently need to debug application-level issues from frontend issues to backend. Value avoiding vendor lock in with OpenTelemetry and open source.
Pricing: The cloud version includes a free tier, and paid tiers charge only based on usage volume at $0.40/GB starting at $20/mo.
Pros:
- Powerful full stack monitoring, to debug issues customer issues that can span from frontend to backend
- Easy to use full-text search for logs and traces
- Flexible dashboarding for any use case
- Self-hostable OSS version
- OpenTelemetry native, reducing vendor lock in risk
Cons:
- Metrics and infrastructure monitoring are not fully fleshed out yet
- Small set of preset dashboards
New Relic
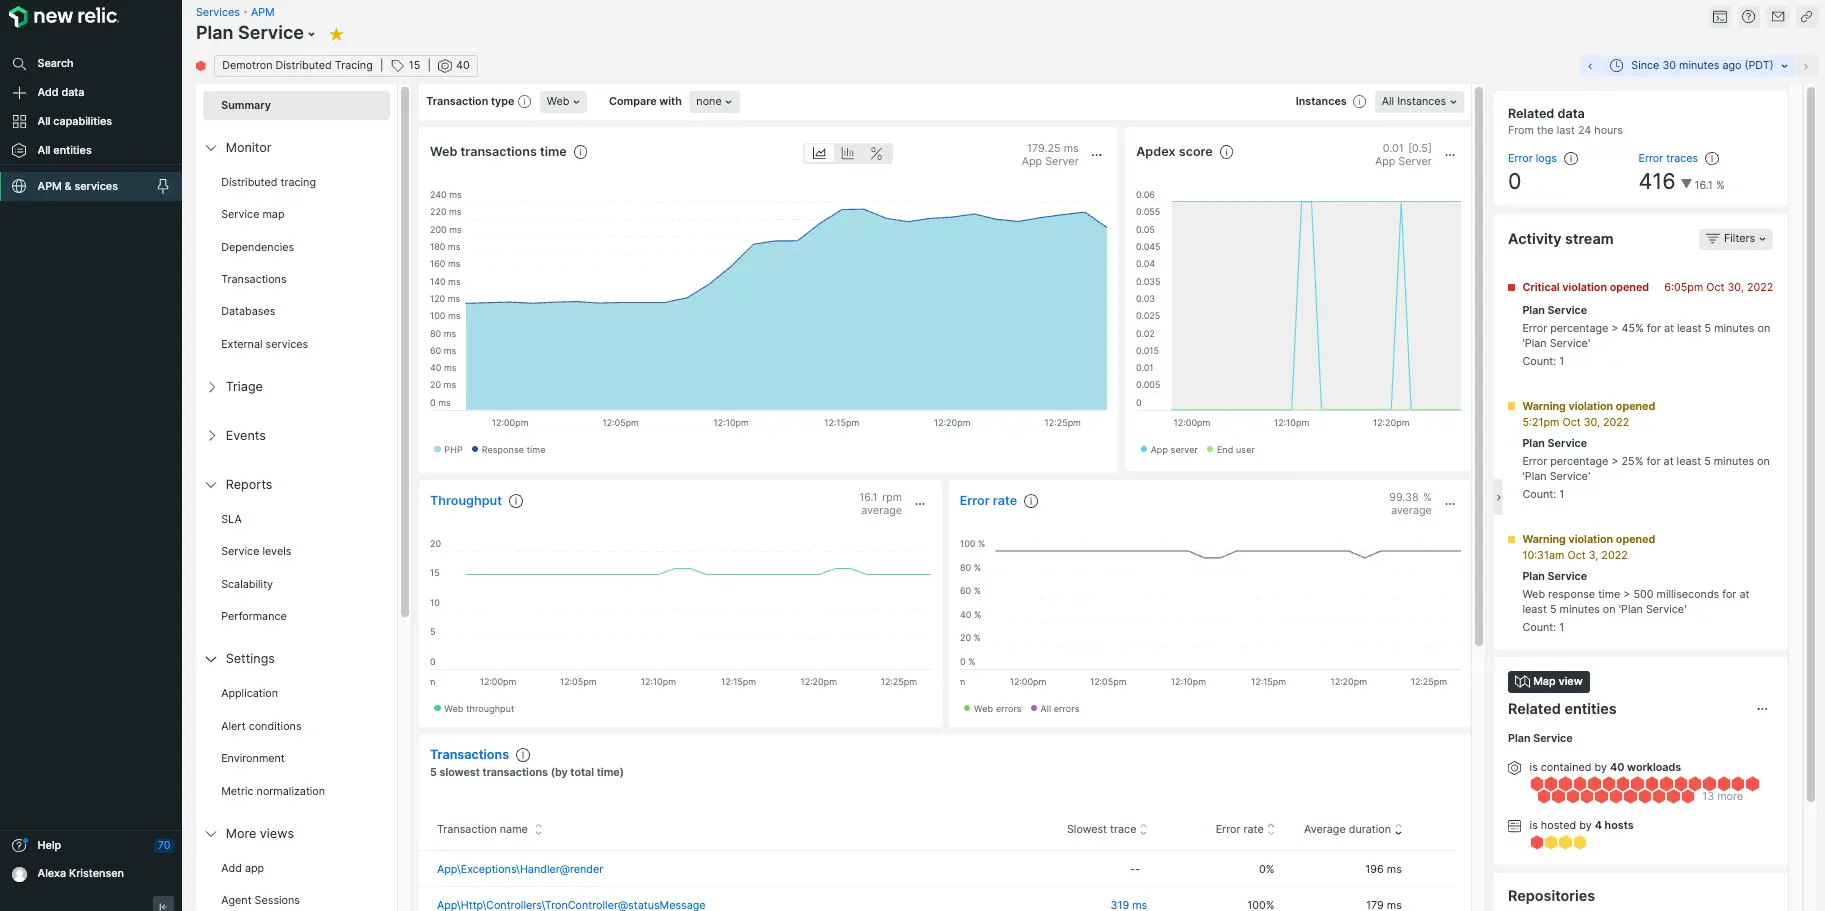
New Relic started off as an APM solution and closely followed Datadog's development path to evolve into an observability platform. It comes with out of the box dashboards for many popular APM use cases and has built up a large library of integrations offered directly by New Relic.
Good For: Teams that are looking for an out-of-the-box app performance tool, especially great for Ruby on Rails applications.
Pricing: Includes a free tier, paid tiers are based on a mix of users (starting at $99/full user) and data (starting at $0.30/GB)

Pros:
- Good out-of-the-box APM dashboards
- Powerful analysis capabilities with NRQL
- Integrates across the entire software stack
Cons:
- User-based pricing might lead to limiting access to observability data from everyone on your team (with pricing going up to $658/mo per user on the enterprise tier)
- UI has gotten complex to access routine features
- NRQL can be difficult to learn
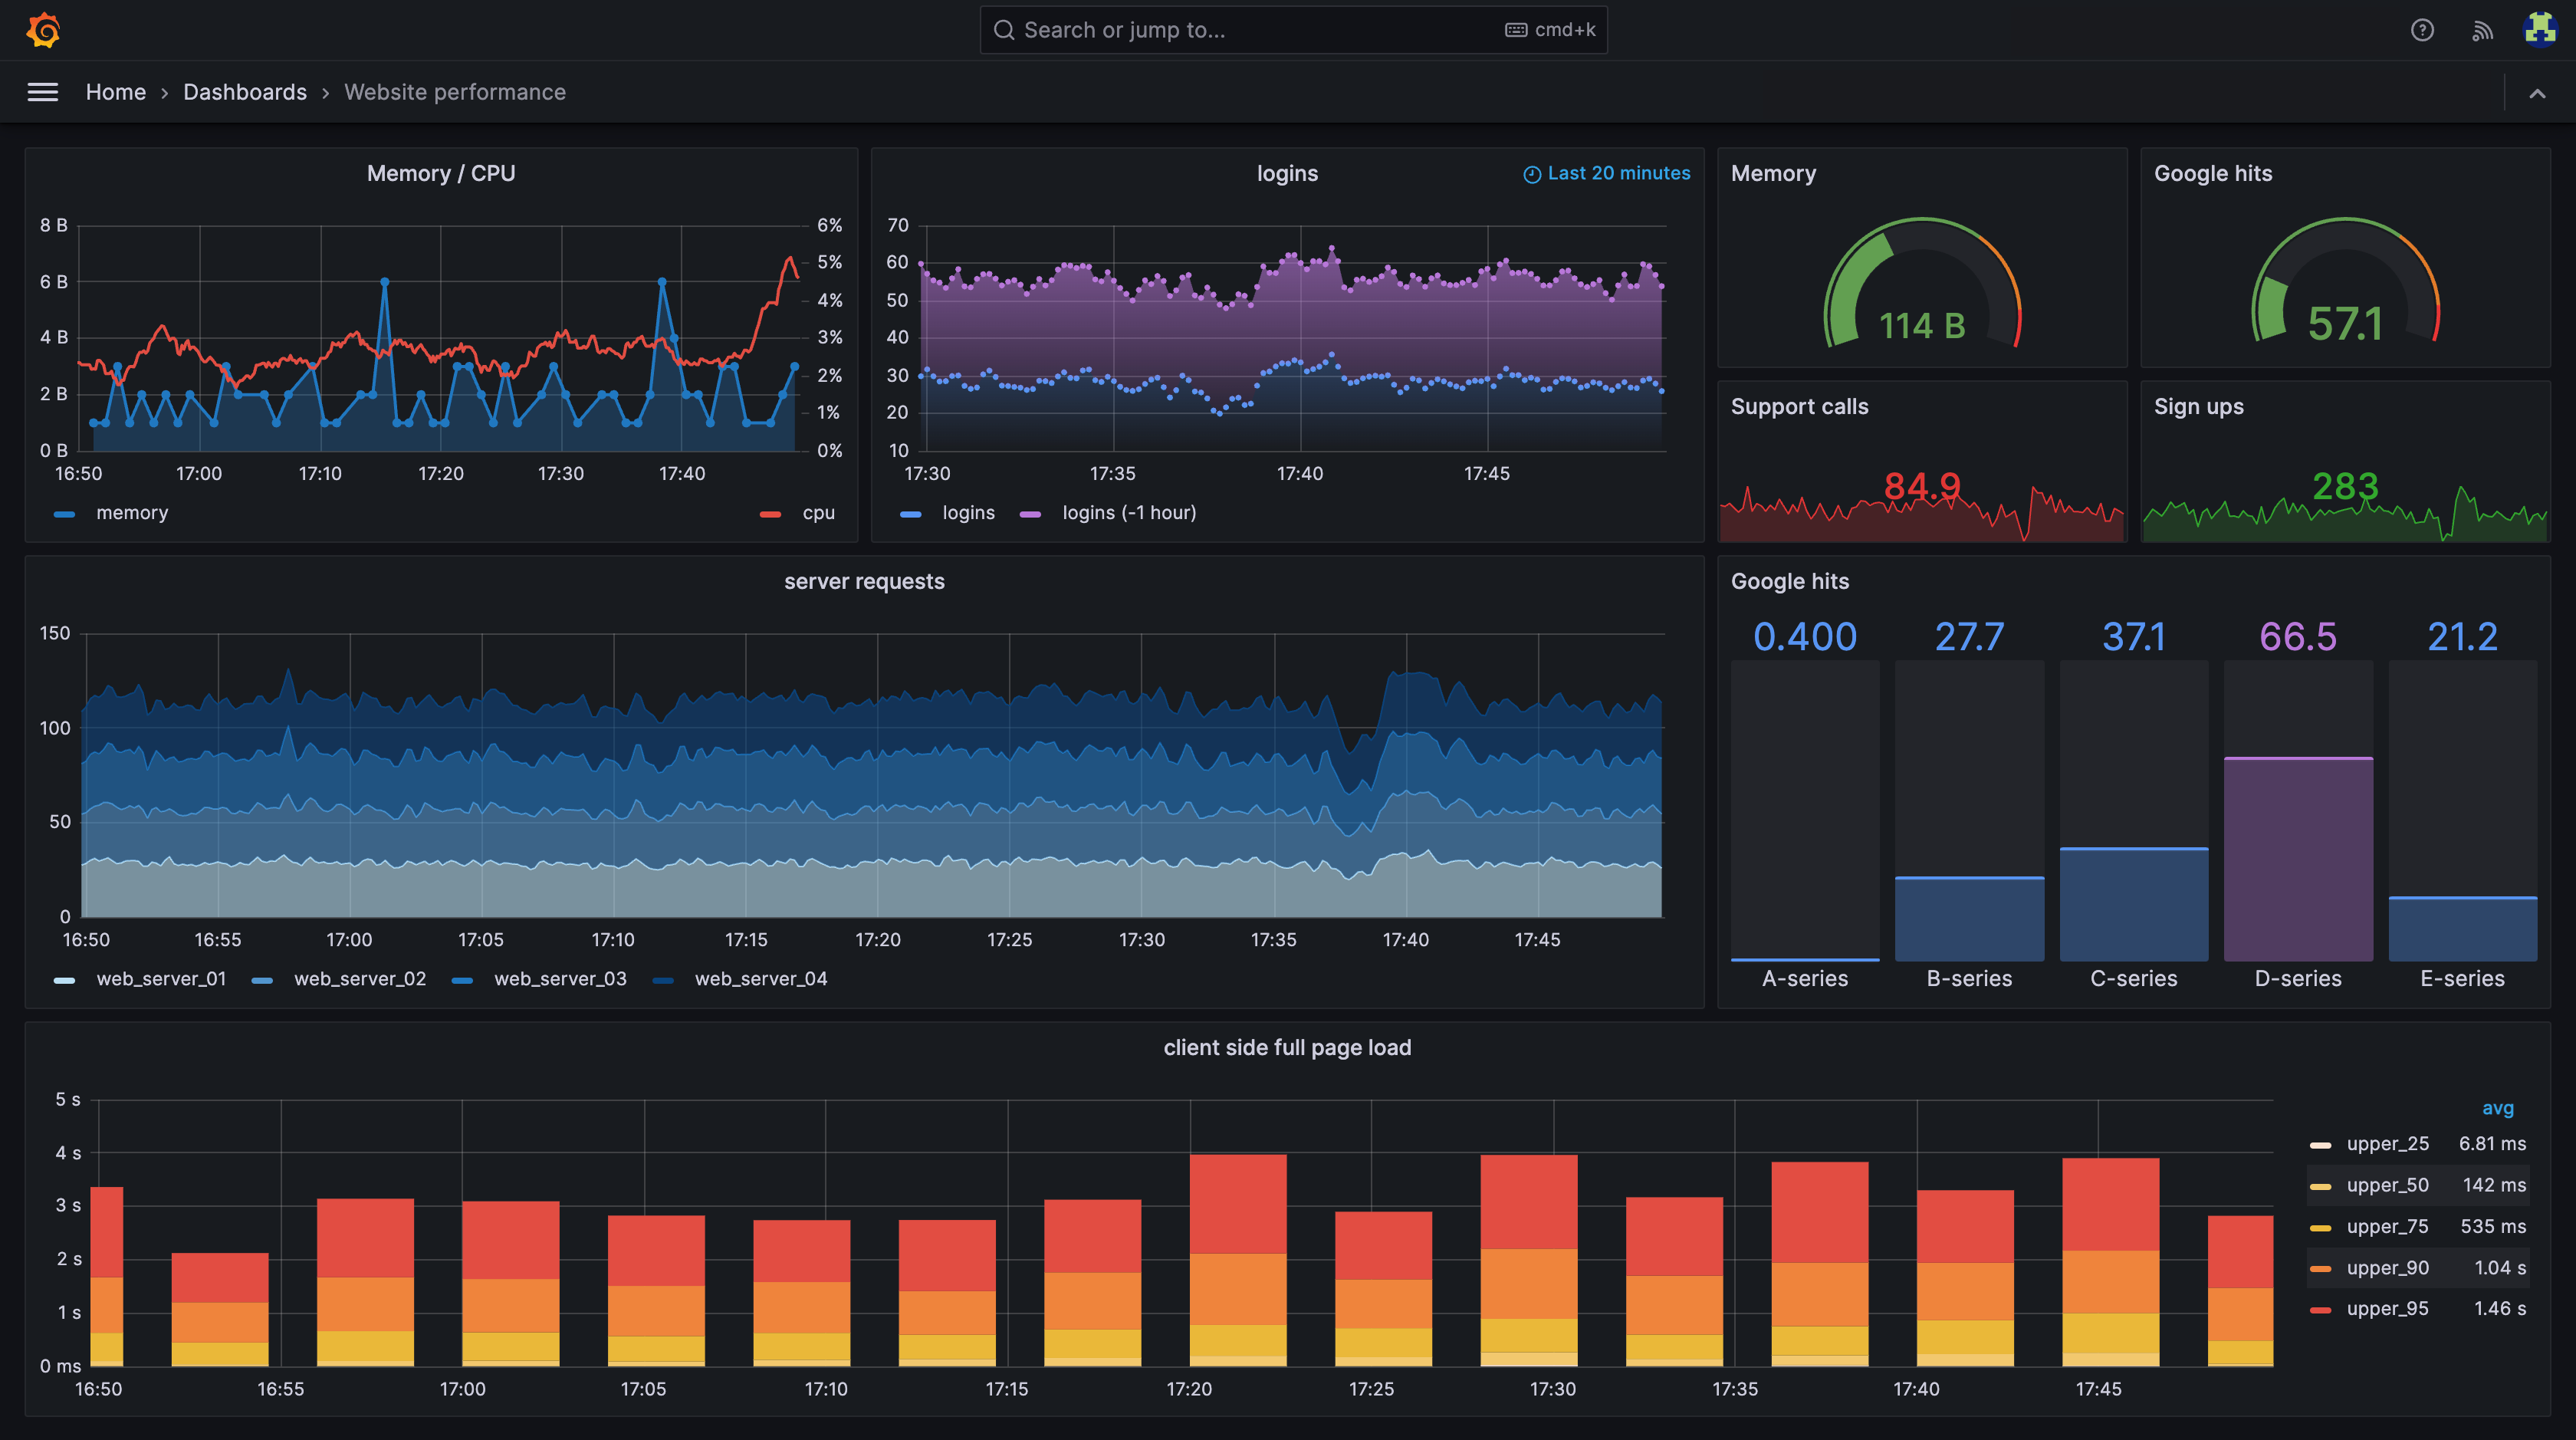
Grafana
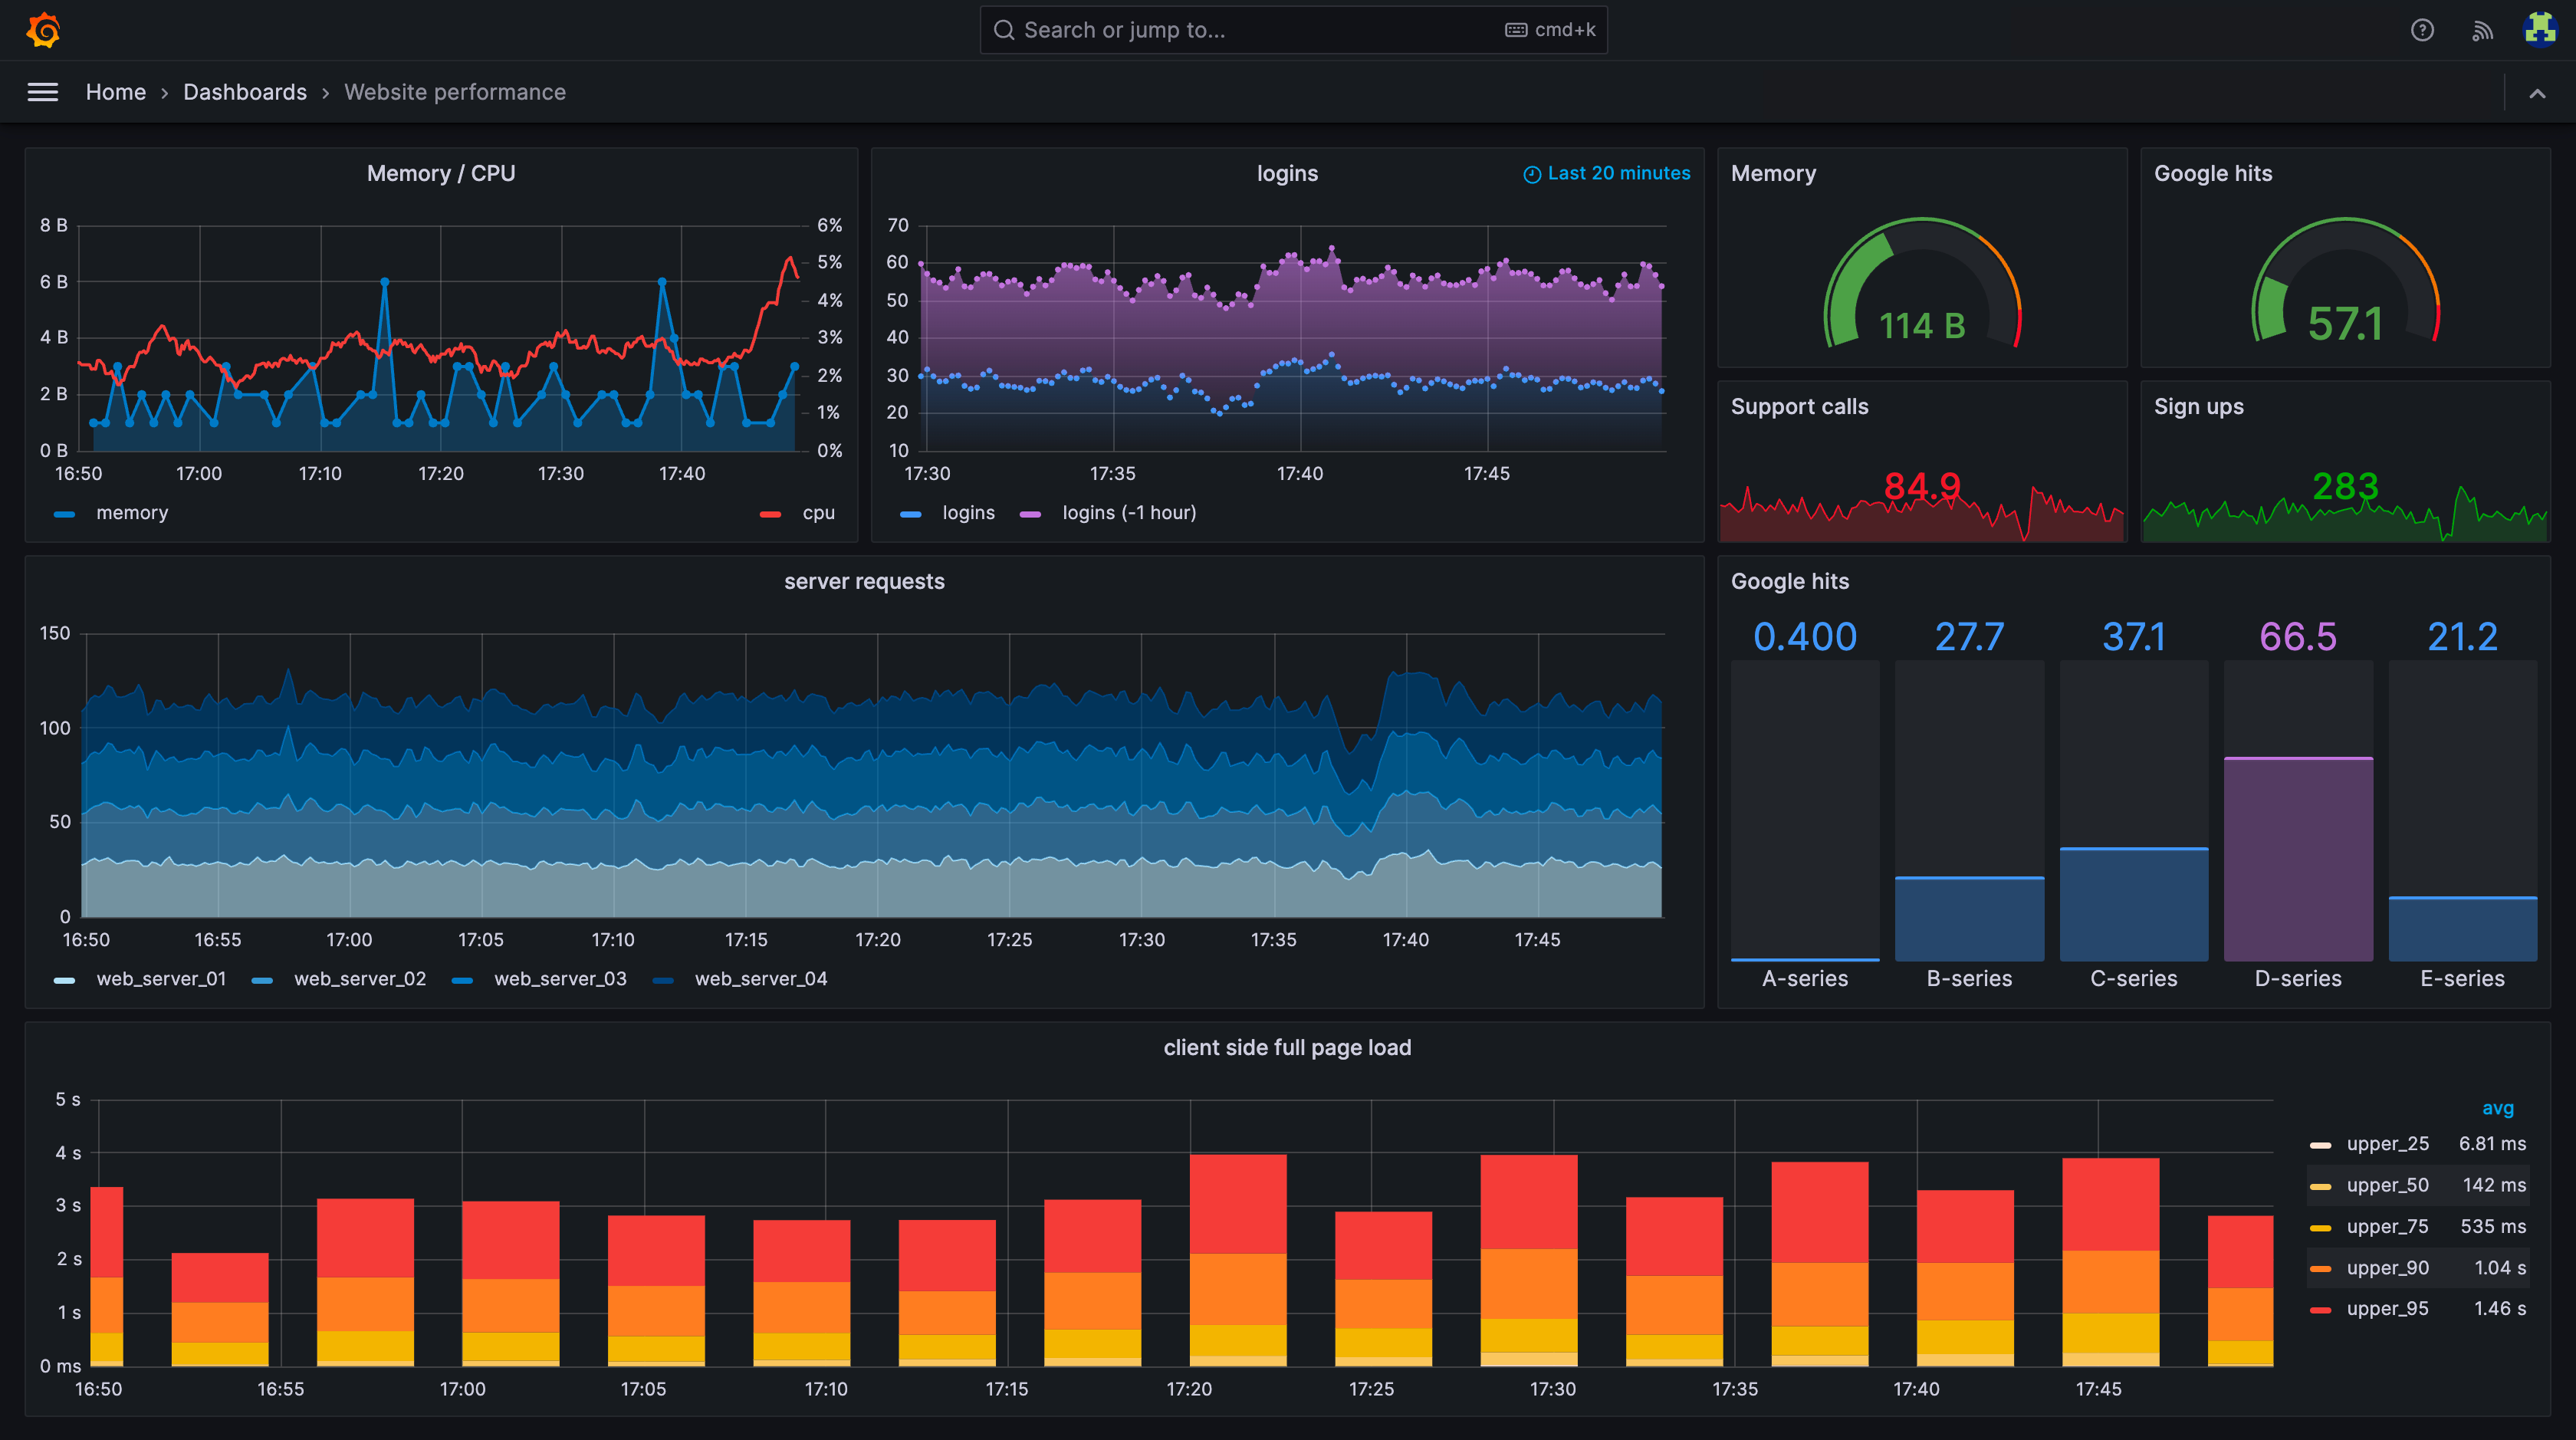
Grafana has become an open source observability platform, originally only focused on visualization of observability data, but has since invested into building out an observability stack for logging (Loki), tracing (Tempo) and metrics (Mimir).
Good For: Teams that have a high focus on metrics monitoring and don’t find logs or tracing as important or useful (or are willing to pair other tools along side), additionally may be interested in self hosting the open source version.
Pricing: Cloud version includes free tier, paid tiers depend on usage volume and starts at $29/mo.
- Pros
- Open source and self hostable
- Flexible dashboarding
- Compatible with a variety of database backends
- Cons
- UX tends to be more power-user friendly and therefore harder for new users to get onboard
- Logs and tracing support is still early
- Limited frontend monitoring support
- Requires a decent amount of maintenance to keep running
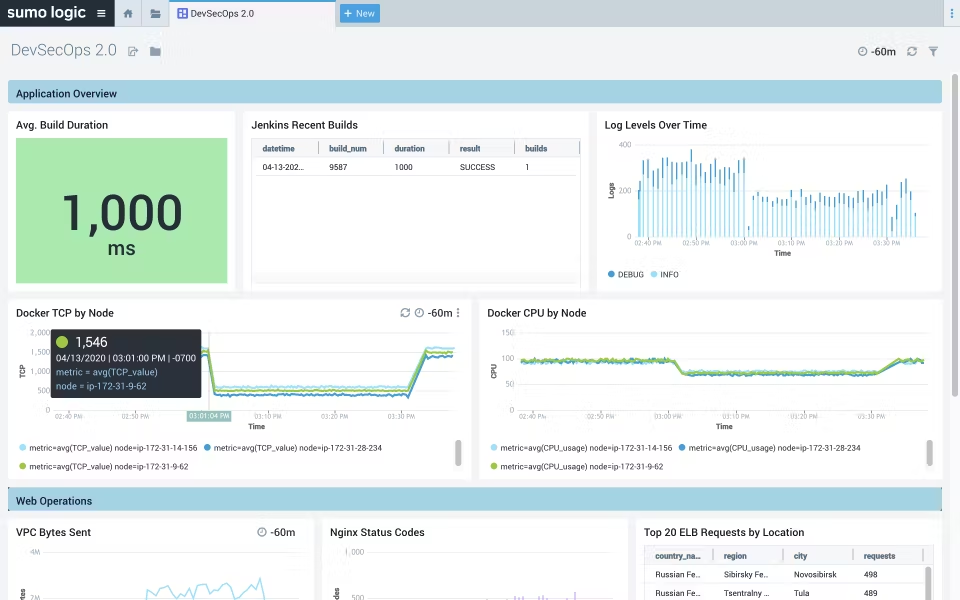
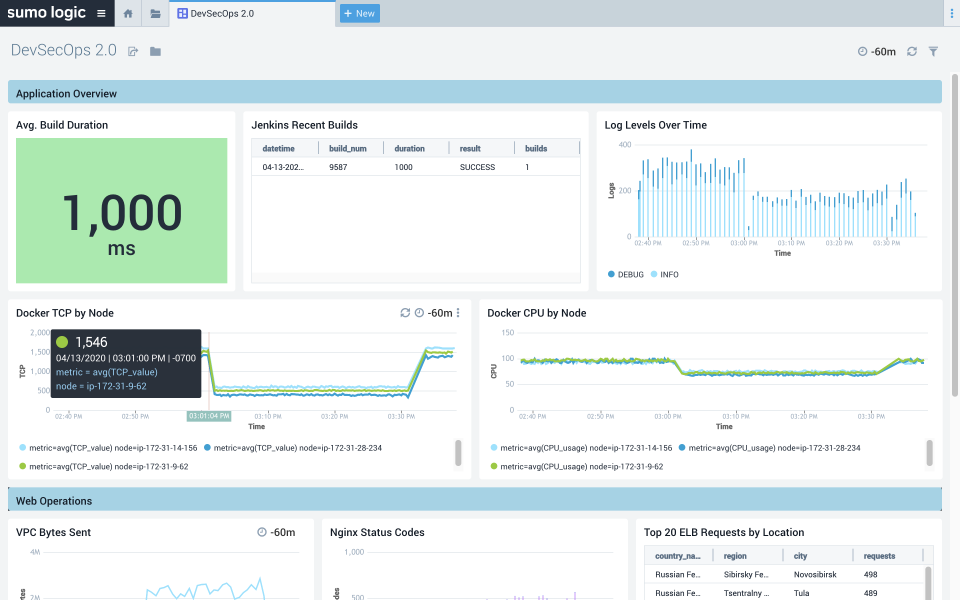
Sumo Logic
Sumo Logic excels at being positioned as an cloud-native Splunk alternative, with a focus on log analysis and security workloads.
Good For: Enterprise teams that primarily want a flexible log analysis/SIEM platform and are willing to invest time into having engineers learn a bespoke query language.
Pricing: Starts at $3/GB with an annual contract, security monitoring requires contacting sales.
Pros:
- Powerful log analysis querying language
- Extensive dashboarding capabilities
- Security monitoring/SIEM
Cons:
- High learning curve for even basic operations due to custom query language
- One of the most expensive products on the market
- Relatively modest observability offering outside of logs
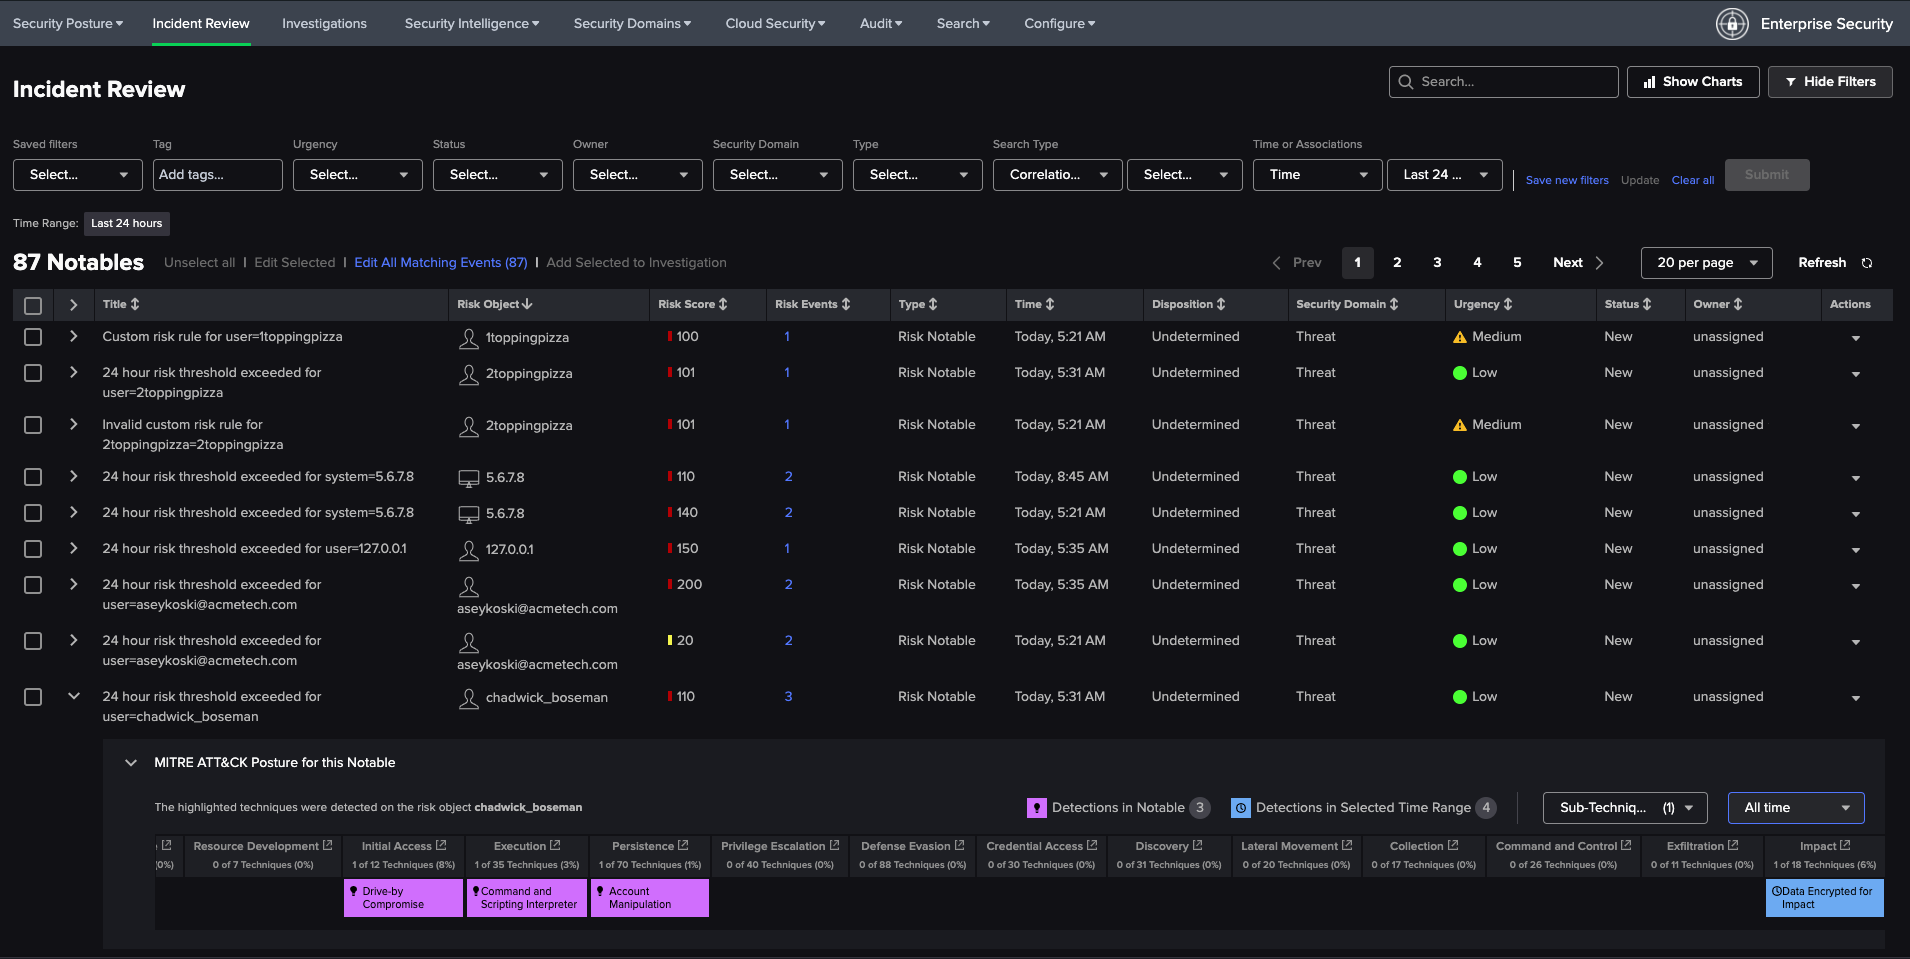
Splunk
Splunk has historically been an on-prem log analysis tool but has since extended into observability with SignalFX and available on the cloud via Splunk Cloud. Today it has a larger focus on SIEM/security use cases.
Good For: Similar to Sumo Logic, meant for enterprises that have an emphasis on security use cases and logs specifically at the expense of a steeper learning curve. Splunk is also often run on-prem which is suitable for highly sensitive industries such as financial institutions.
Pricing: Generally known as one of the most expensive products in the industry, with all pricing tiers requiring contacting sales.
Pros:
- Powerful log analysis querying language
- Extensive dashboarding capabilities
- Can run on-prem via Splunk Enterprise
- Large community of users to answer questions
Cons:
- High learning curve for even basic operations
- One of the most expensive products on the market
- On-prem installation can be difficult to manage
- Splunk Cloud has not been seen as robust as their on-prem offering
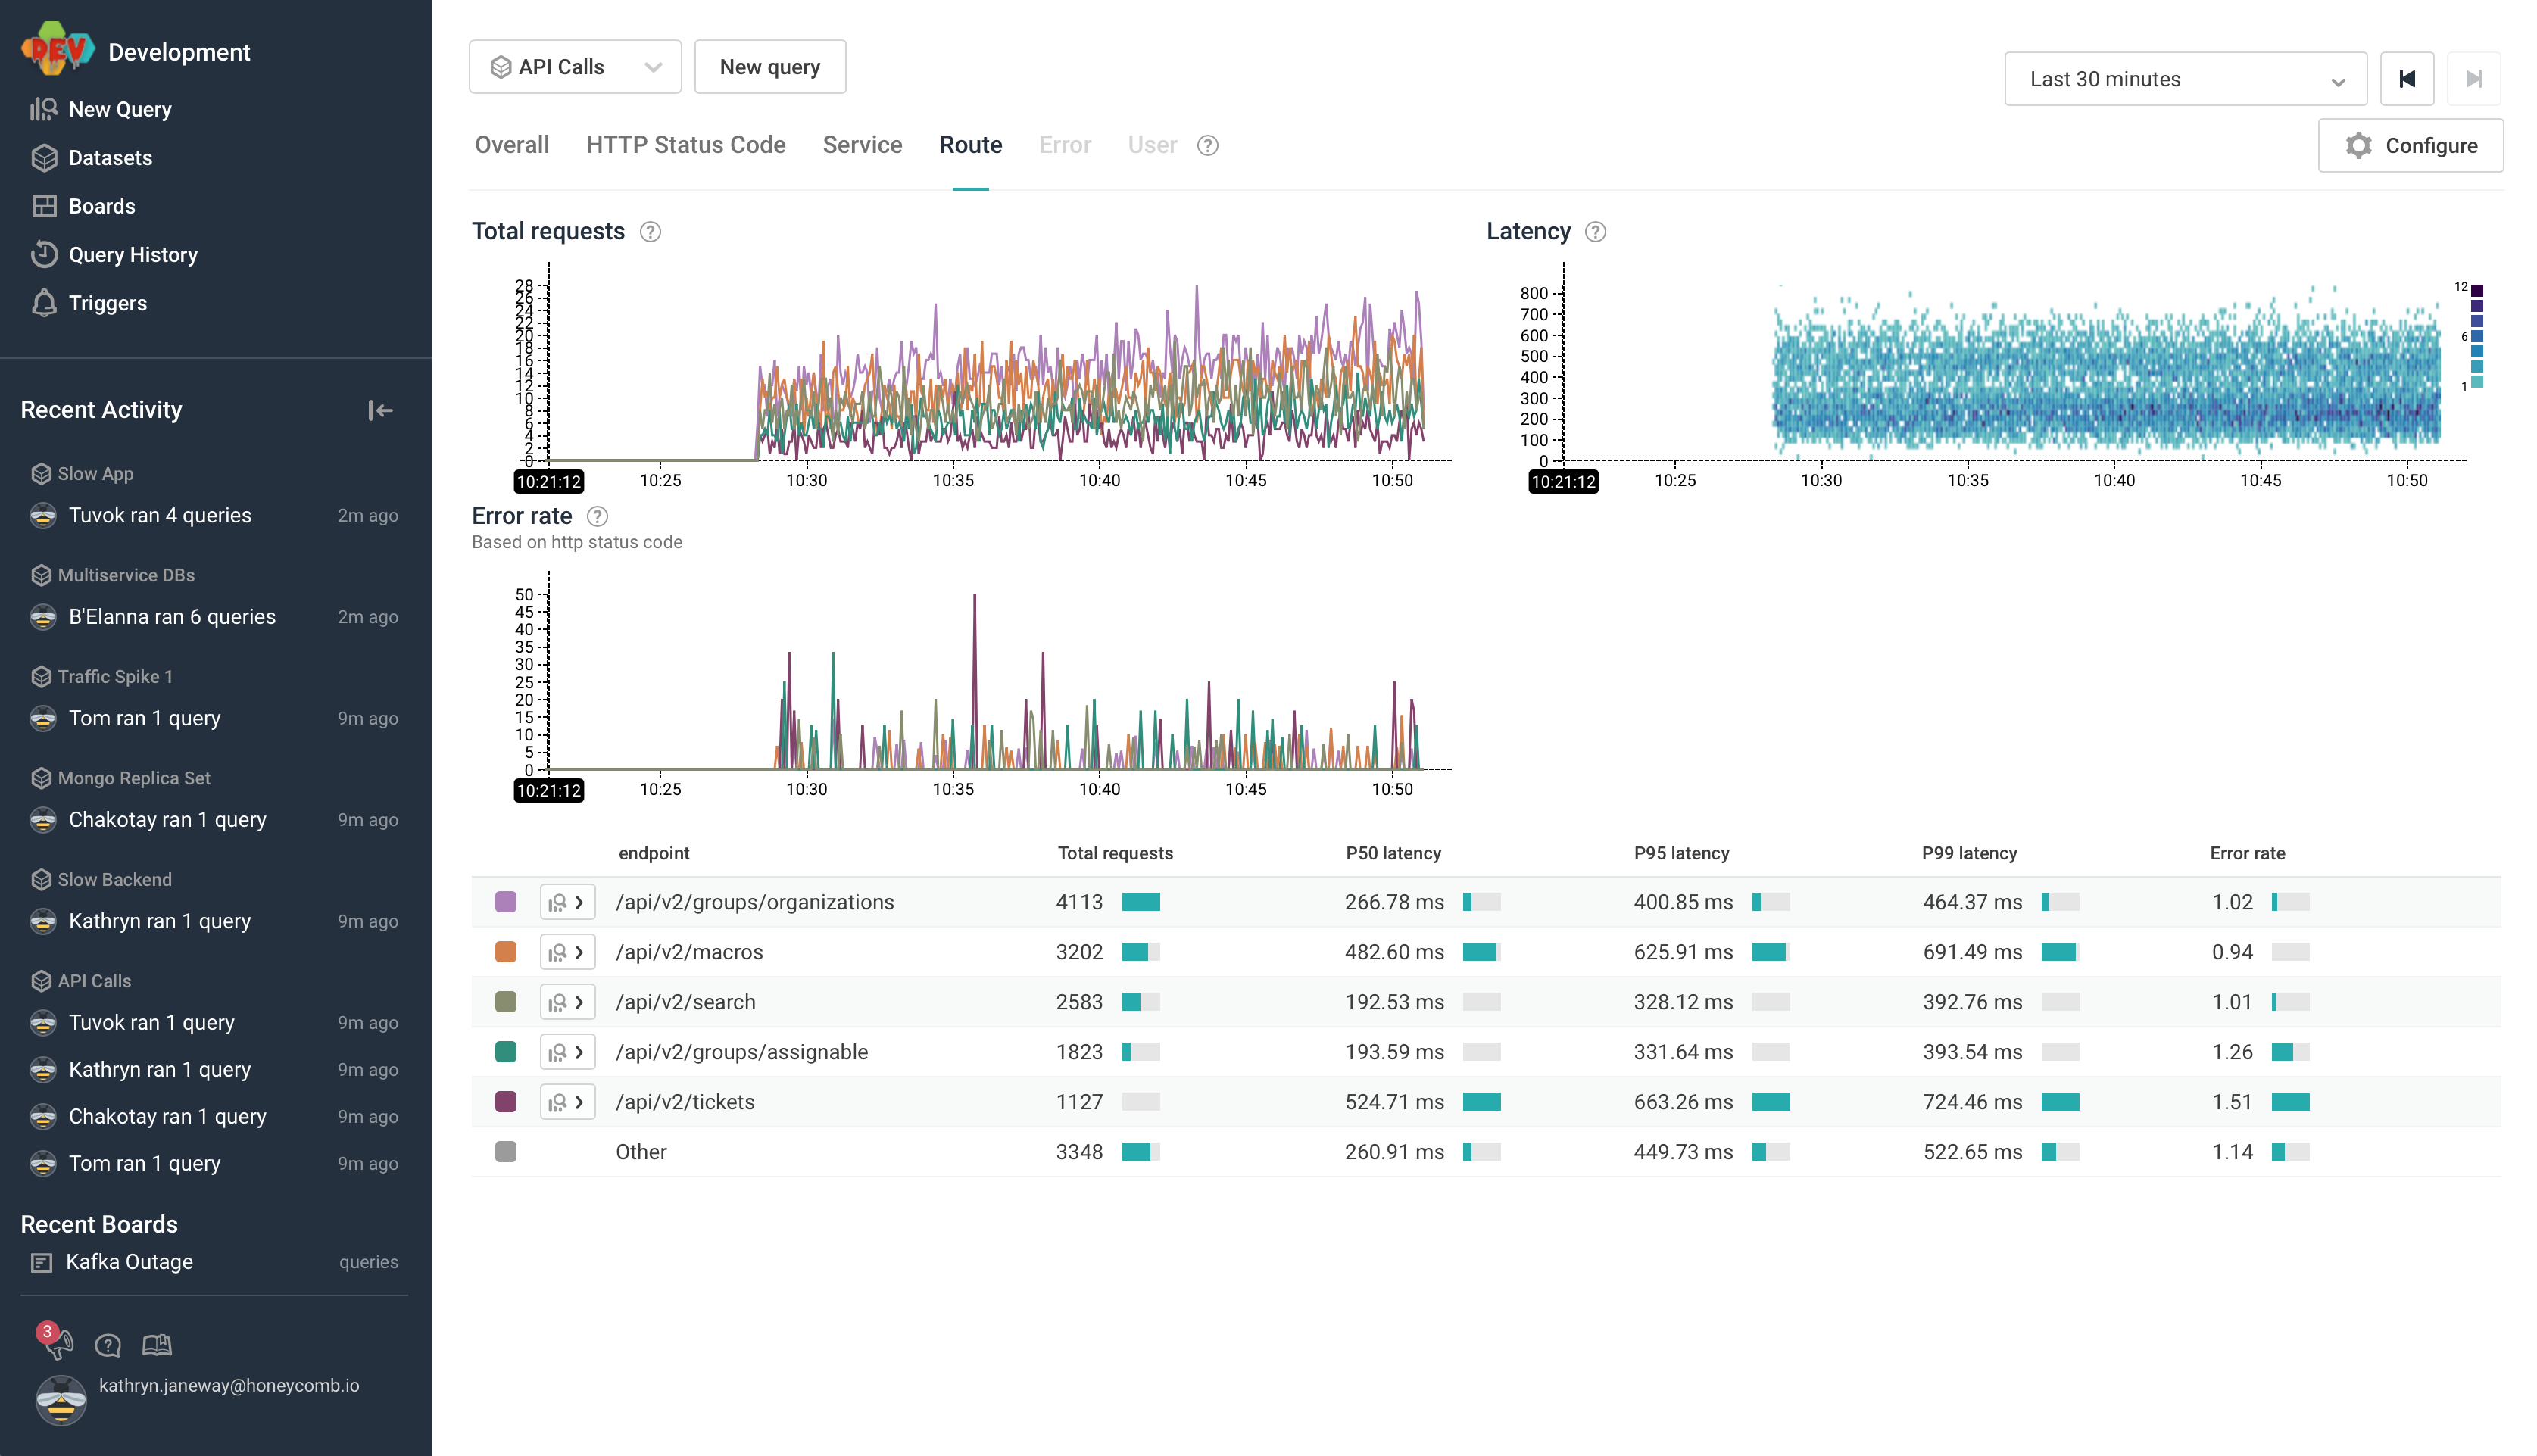
Honeycomb
Honeycomb is primarily a distributed tracing platform that helps developers analyze traces. Recently they've expanded into collecting metrics as well.
Good For: Teams that have already invested into distributed tracing and are looking to invest more time into advance statistical analysis of their distributed tracing for incidents.
Pricing: Free tier, with fixed tiers at $130, $585 and $1,950/mo depending on event volume.

Pros:
- Able to do complex statistical analysis on distributed traces
- Ability to track SLOs/error budgets
- Mature OpenTelemetry support
Cons:
- Relatively low support for general logs as it doesn't fit natively in Honeycomb's event model
- High learning curve for querying outside of simple events
- Can't view live stream of events
- Limited frontend monitoring support
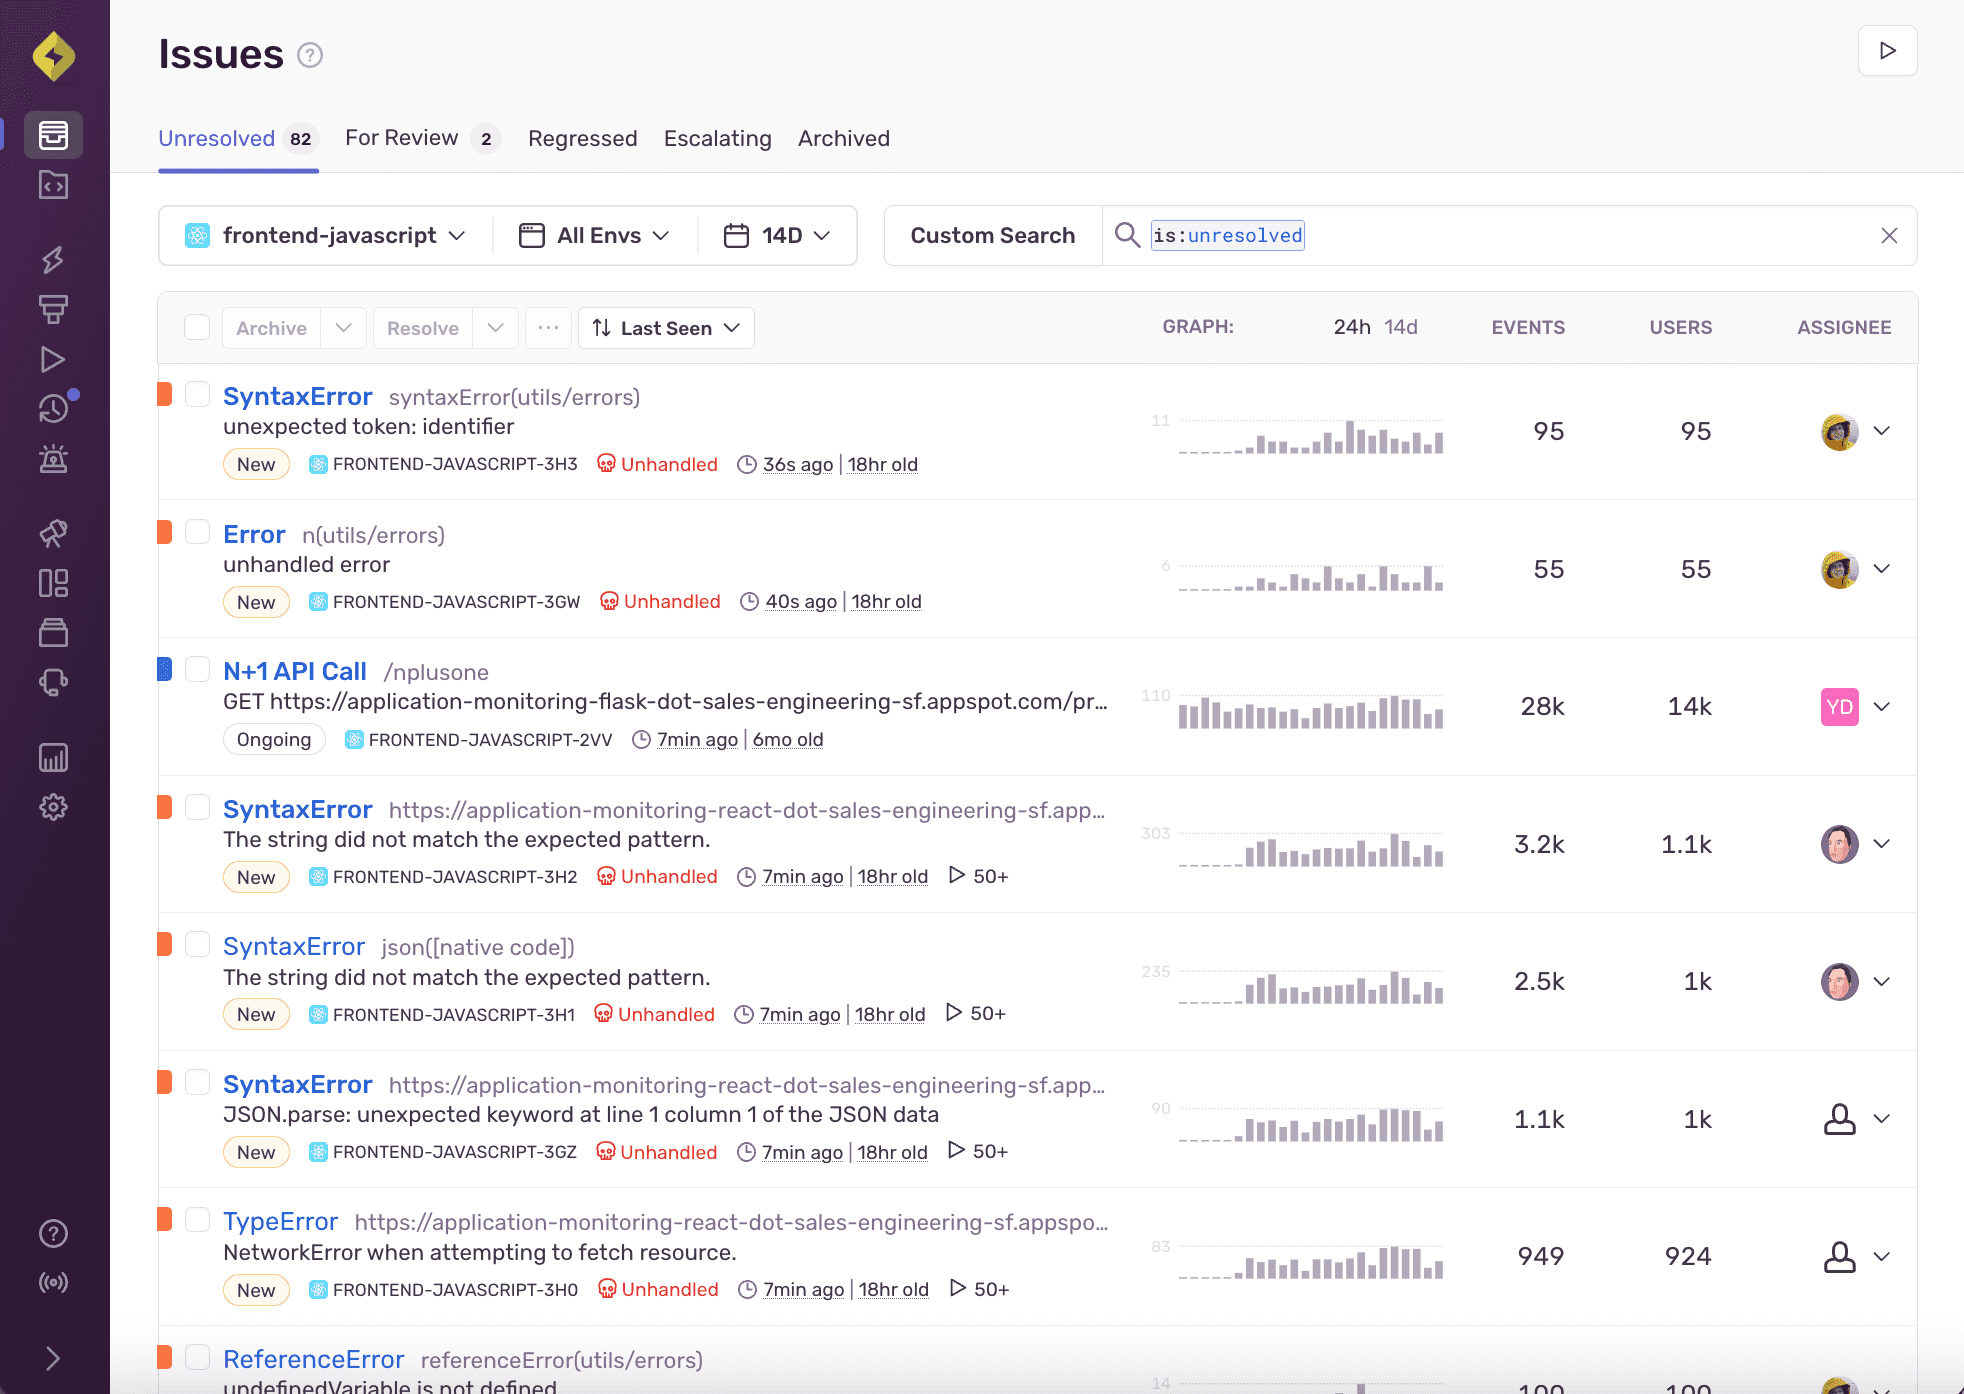
Sentry
Sentry is an application monitoring platform, primarily around collecting and alerting on exceptions at the application-level, as well as collecting APM information.
Good For: Capturing and alerting on exceptions with call stack context. Typically paired with other observability tools to get full coverage around issues beyond the immediate call stack.
Pricing: Free tier, with paid tiers starting at $26/mo and scales based on event volume (number of exceptions and transactions).
Pros:
- Easy setup with language-specific SDKs
- Support for source maps on frontend applications
- Alert grouping clustering similar exceptions
Cons:
- Pricing tends to scale poorly as number of events grow
- Alerts can often be noisy and cause alert fatigue
- Exceptions alone often don't provide sufficient context to fix an issue and require additional context from other observability tools
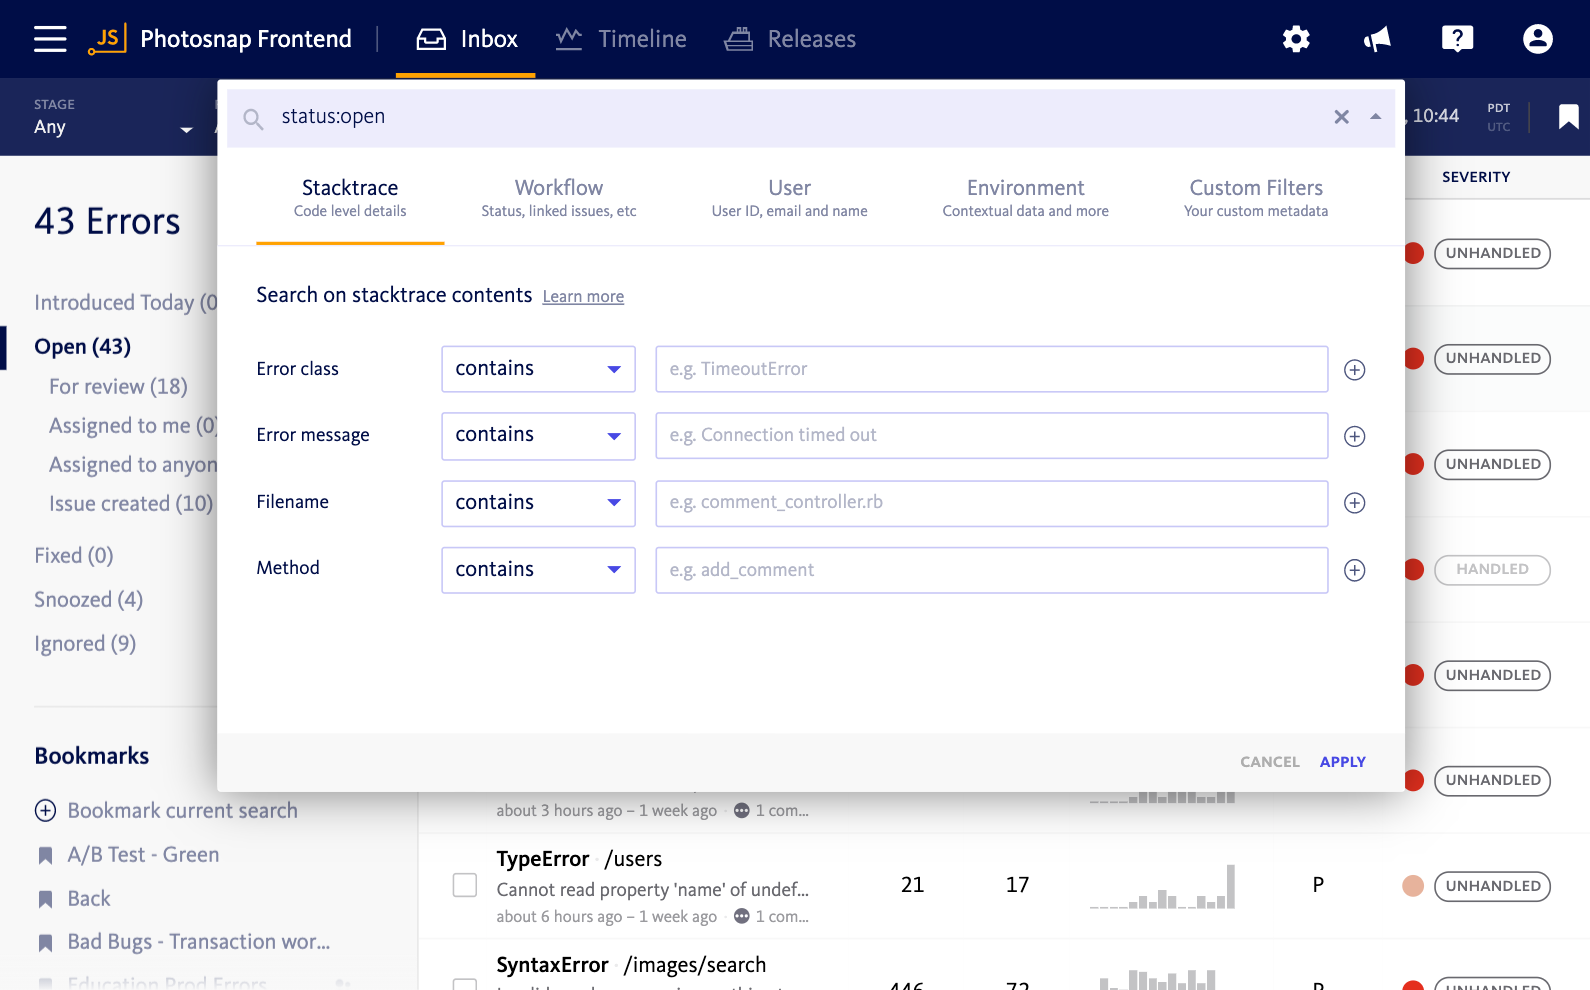
Bugsnag
Bugsnag is similar to Sentry in being an application monitoring platform largely focused on exceptions and recently added basic performance monitoring in its bid to expand into the broader observability market.
Good For: Teams with a focus on specifically exceptions, requires other observability tools to get full coverage of issues beyond exceptions.
Pricing: Free tier, with paid tiers starting at $76/mo and scales based on event volume and users.
Pros:
- Easy to set up with language-specific SDKs
- Source map support
- Grouping for similar exceptions
Cons:
- Limited feature set outside of capturing exceptions, with basic performance monitoring only released a few months ago.
- Alerts can often be noisy and cause alert fatigue.
- Can not be self-hosted
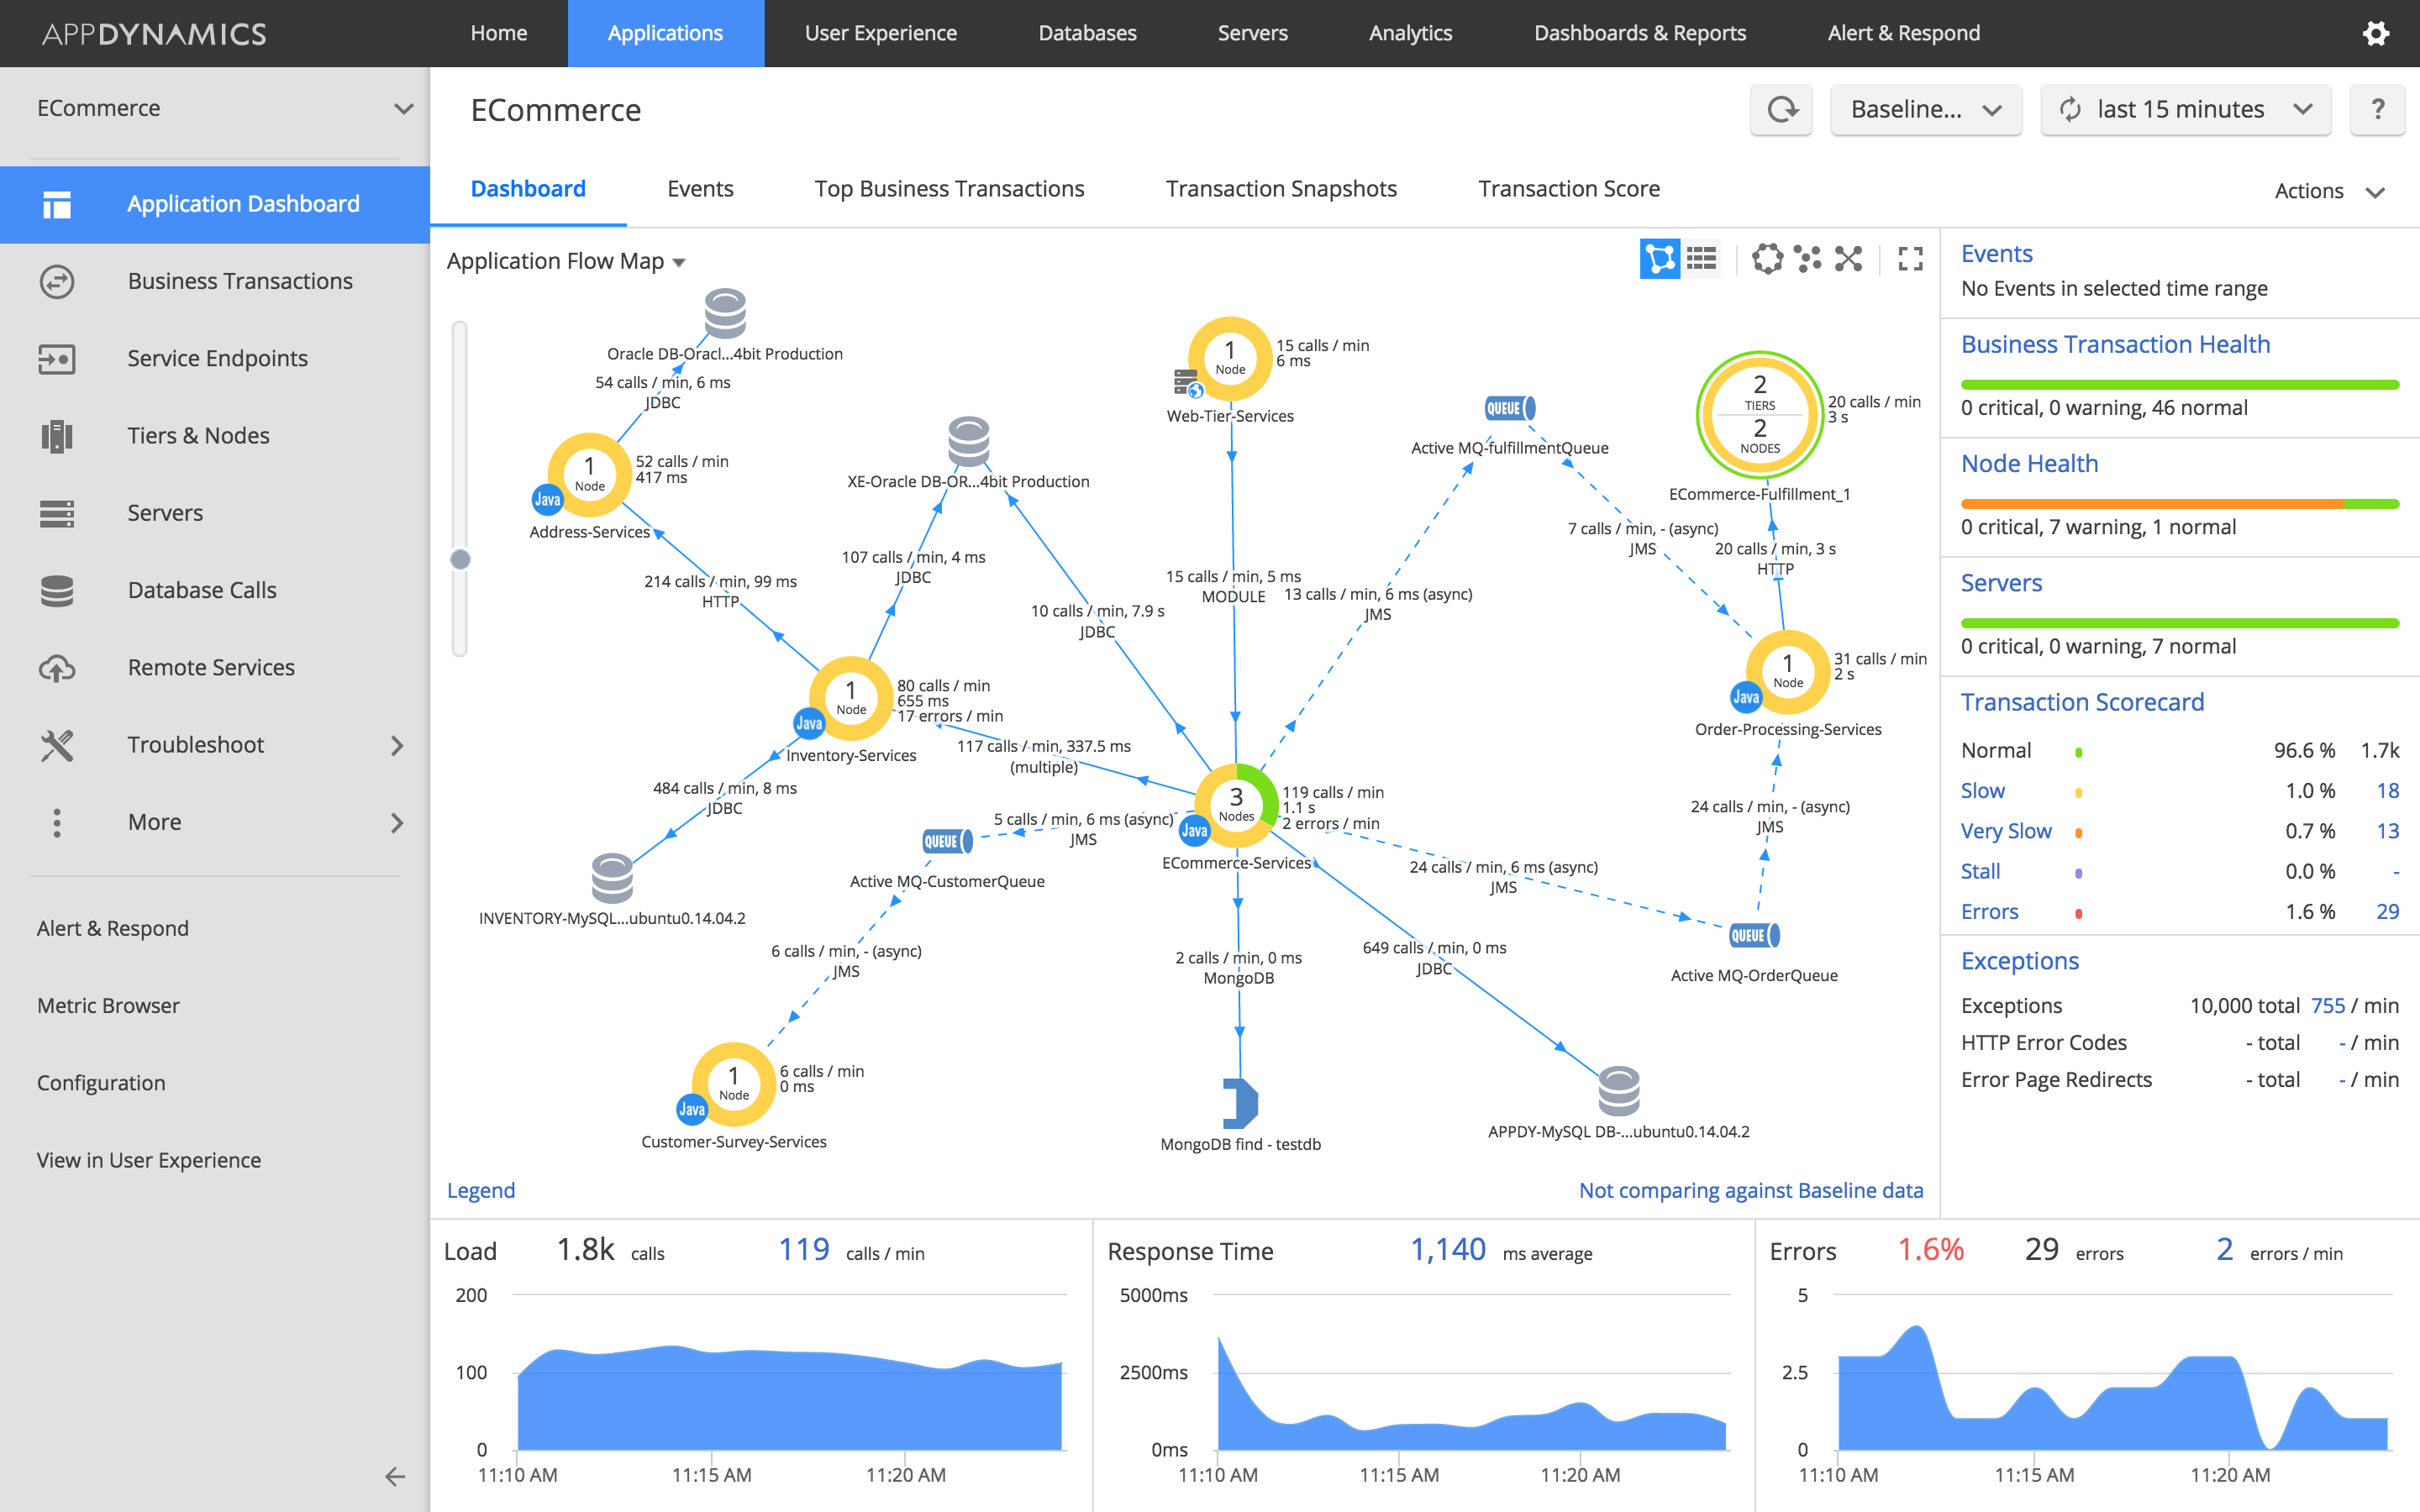
AppDynamics
AppDynamics primarily focuses on app performance management, with the ability to tie observability events with business metrics/labels.
Good For: Enterprises looking to tie together APM data with business metrics.
Pricing: Primarily based on per CPU core, with APM starting at $33/mo per CPU core.

Pros:
- Ability to tie observability events to semantic business events
- Powerful tools for analyzing performance monitoring/distributed traces
Cons:
- Expensive pricing, and is tied to CPU capacity rather than actual usage.
- Relatively basic support for querying logs and metrics
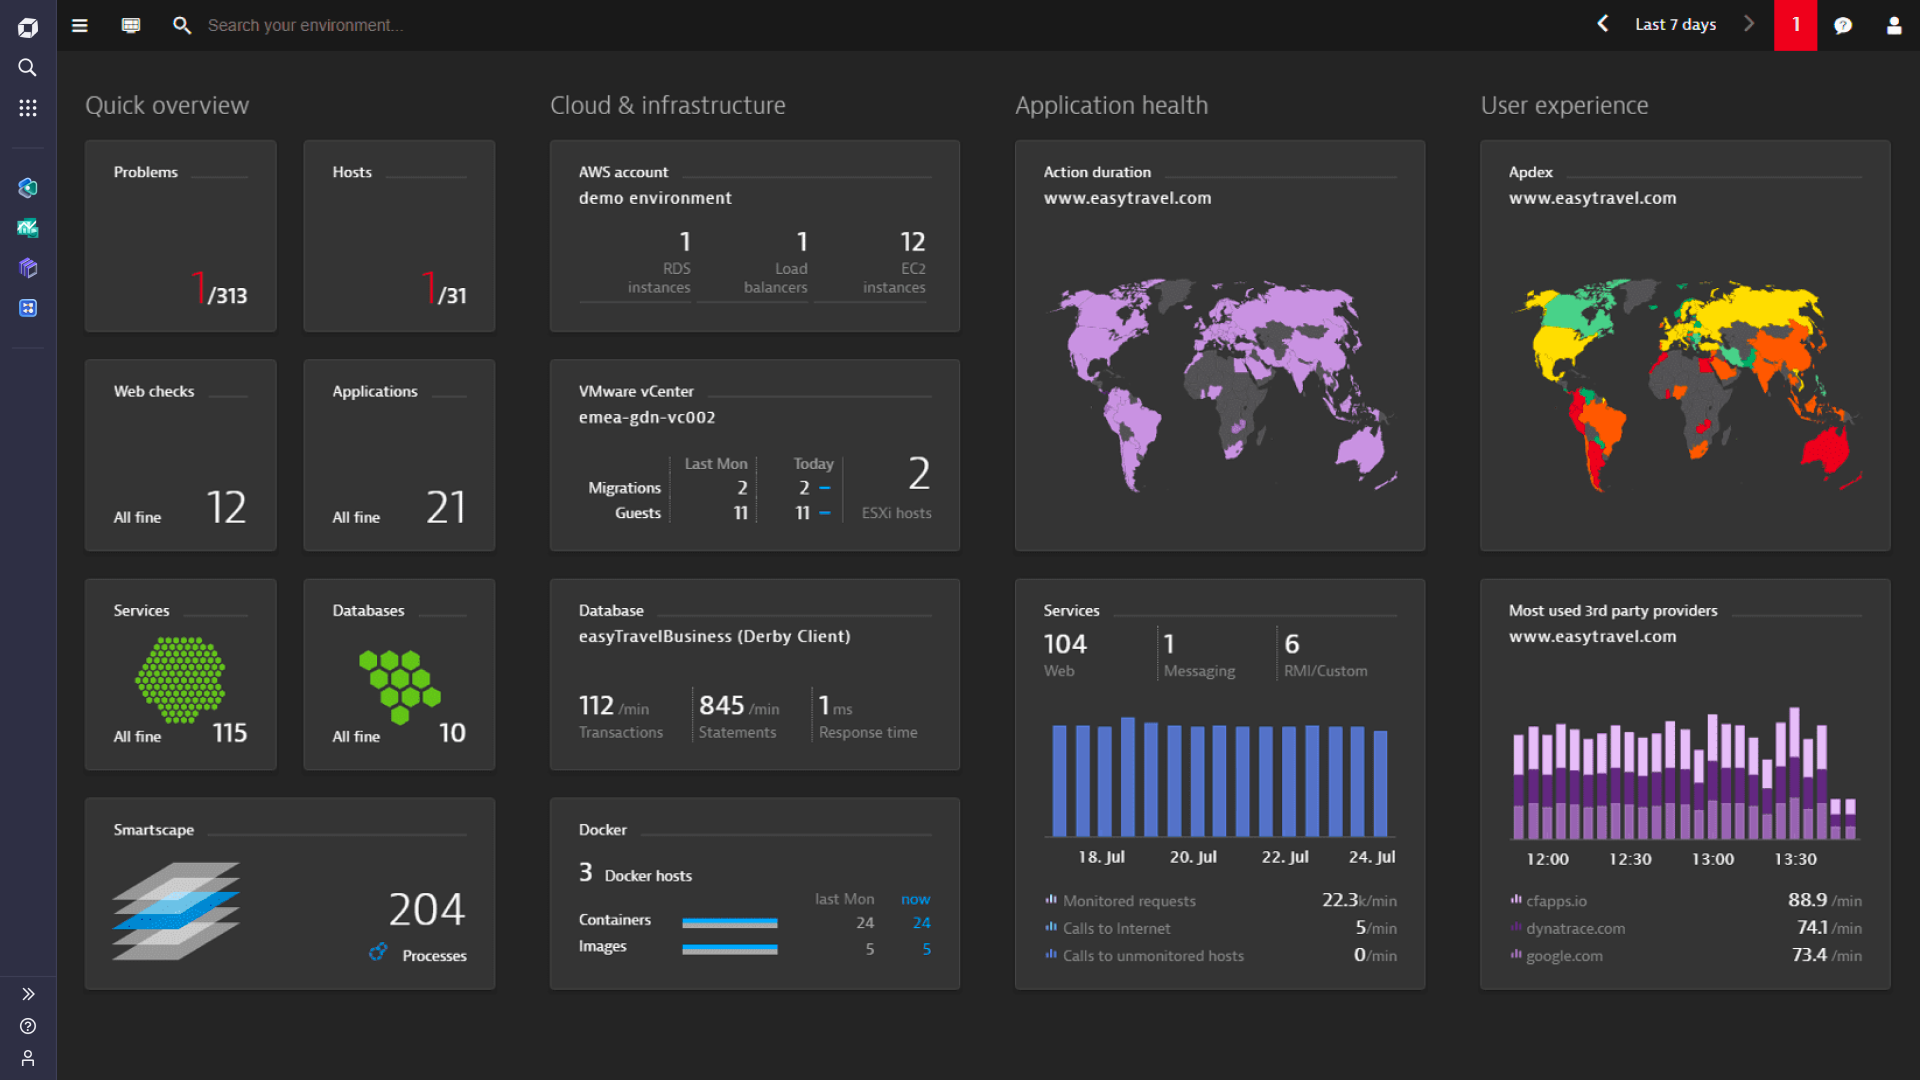
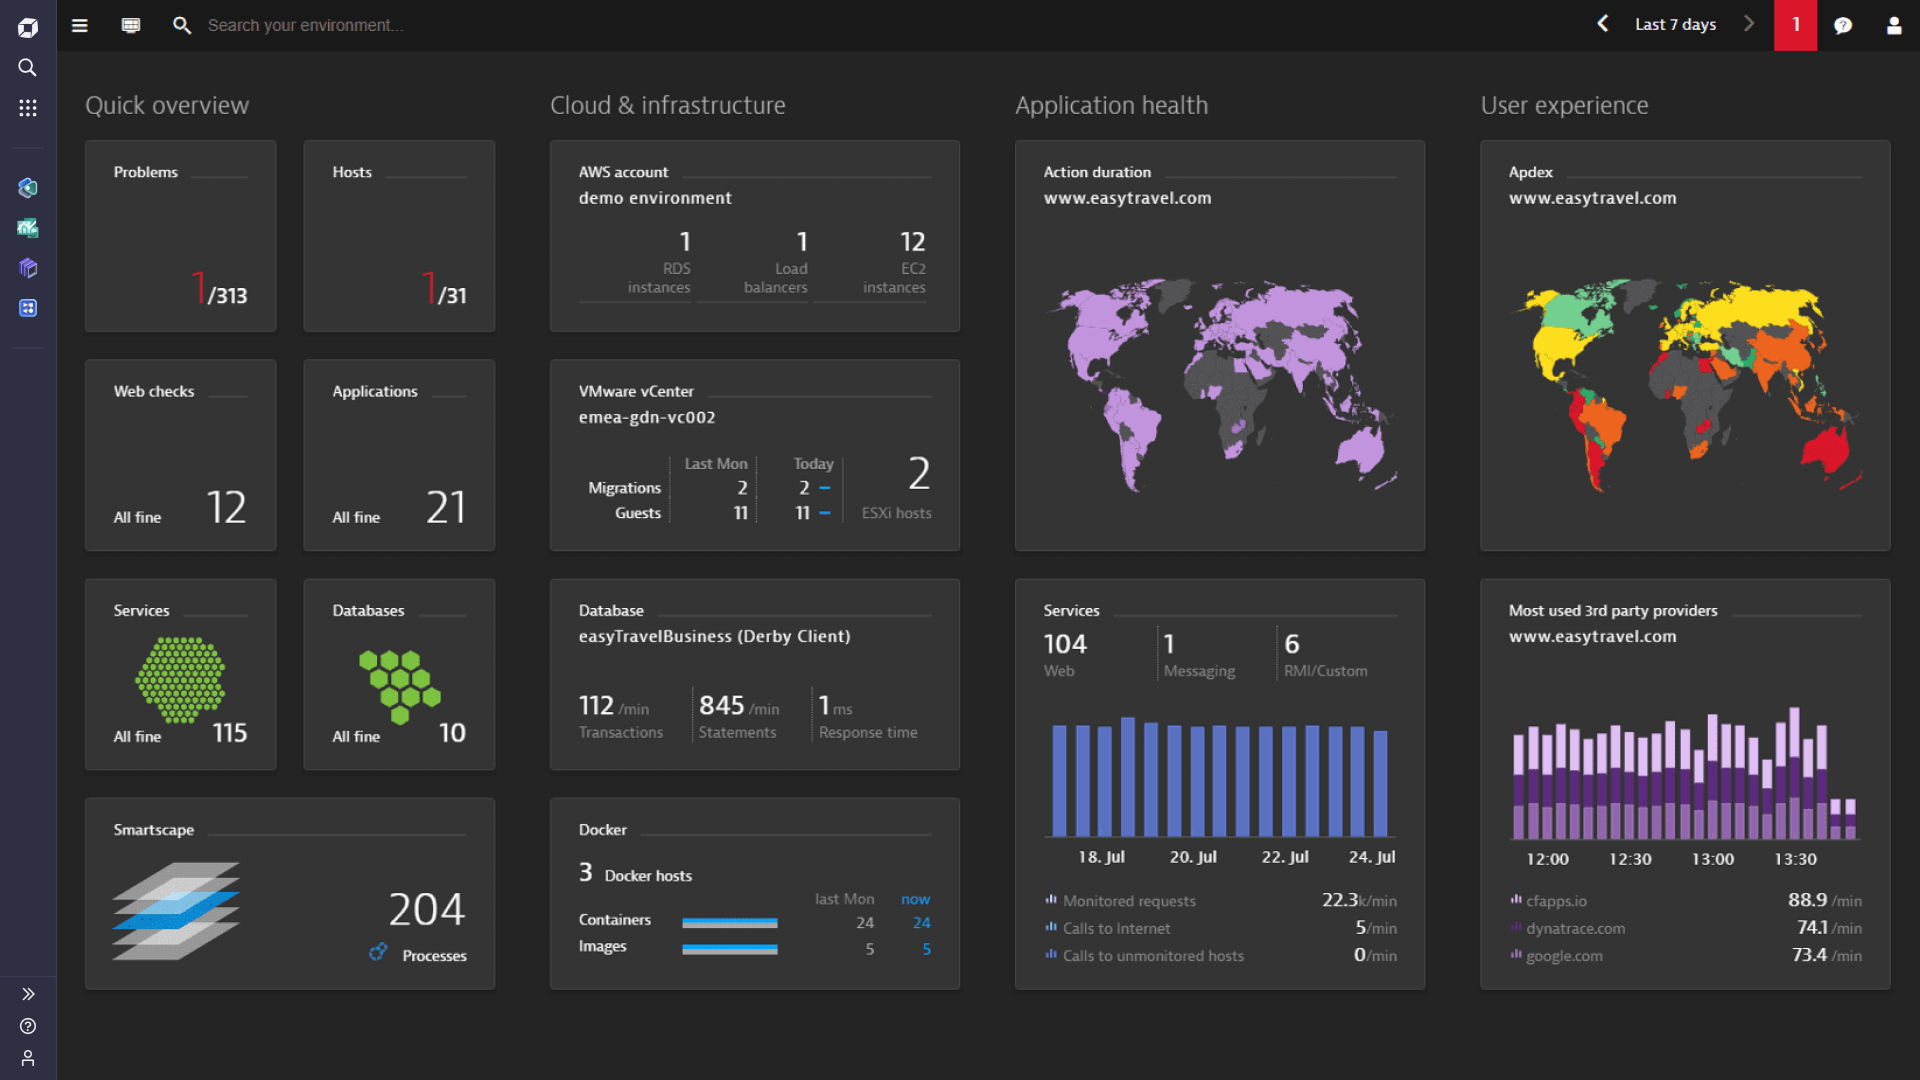
Dynatrace
Dynatrace focuses primarily on application performance management, with an emphasis on their AI integration to spot anomalies and process natural language queries.
Good For: Teams looking to set up APM without code changes, or wish to integrate AI into their observability workflows.
Pricing: Based on a complex combination of hosts and event size without a free tier.
Pros:
- OneAgent can auto-inject APM instrumentation at the host level.
- One of few vendors to offer per-query pricing for logs.
- Integrated AI for natural language queries and anomaly detection.
Cons:
- Complex pricing model can make it difficult to predict costs depending on products used.
- Building analysis dashboards outside of the prebuilt ones can be challenging
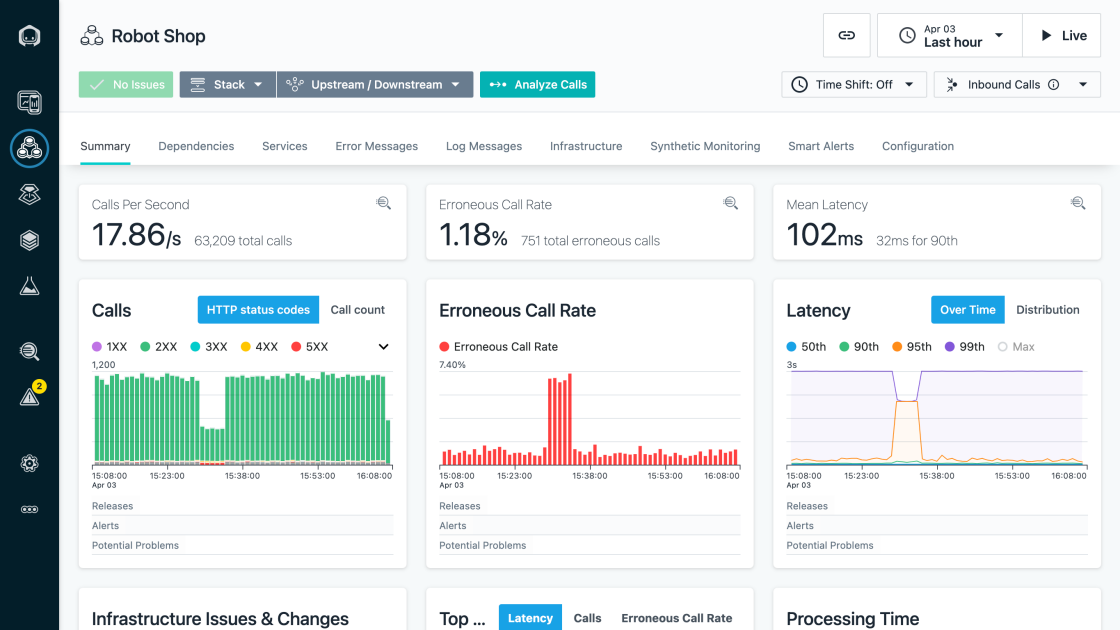
IBM Instana
Instana primarily focuses on application performance monitoring, with support for basic infrastructure monitoring and logging.
Good For: Enterprises focused on APM insights over logging or infrastructure monitoring, especially if on-premise deployments are required.
Pricing: Based on per host, with pricing starting at $697/mo.
Pros:
- Automated root cause analysis
- Powerful APM analysis capabilities
- Able to be deployed on-premise
Cons:
- High minimum pricing along with a per-host pricing as opposed to usage-based.
- Logging and infrastructure monitoring are relatively under-developed on the platform
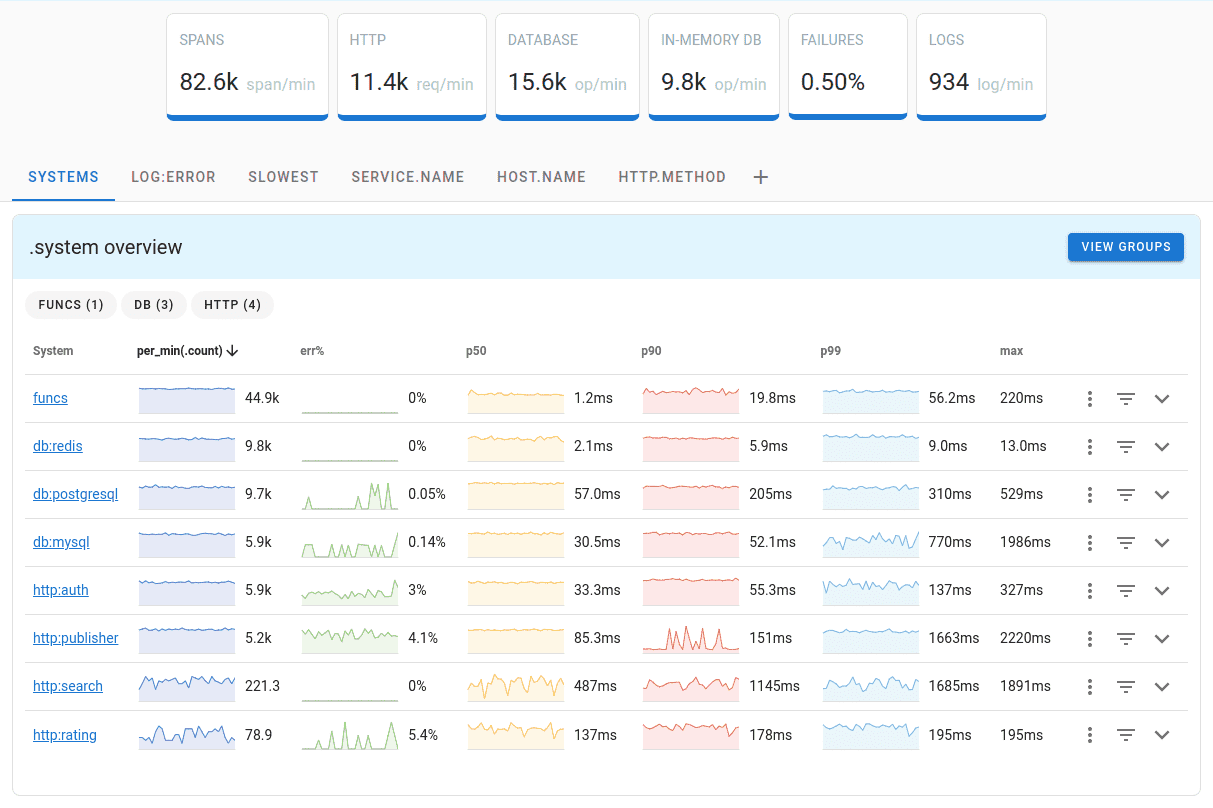
Uptrace
Uptrace is a newer open source observability platform focused on lower cost of storage and analysis around aggregating events together.
Good For: Small teams looking for a place to store their OpenTelemetry data, and may only need to query them occasionally.
Pricing: Free tier with paid tiers starting at $30/mo and $0.08/GB and $2 per 1,000 metrics
Pros:
- Affordable pricing
- Open source and self-hostable
- Pre-aggregated traces and logs
Cons:
- Limited querying and analysis capabilities
- Limited alert conditions
- Relatively basic UI makes for navigating through logs and events difficult
Conclusion
While Datadog is an inclusive observability platform with comprehensive monitoring capabilities, it poses a few challenges/risks around pricing and vendor lock-in. Similarly, no alternative on the market is perfect either but hopefully you now have a better idea of the various pros and cons of different vendors to make an informed decision based on your team's requirements.
If you're interested in trying out HyperDX, you can sign up for free (opens in a new tab), schedule a call (opens in a new tab), or check out our project on Github (opens in a new tab).