Search
HyperDX allows you to do full text search on your events (logs and spans). You can get started searching by just typing keywords that match your events. For example if your log contains "Error", you can find it by just typing in "Error" in the search bar.
This same search syntax is used for filtering events with Dashboards and Charts as well.
Search Syntax
- Searches are not case sensitive
- Searches match by whole word by default (ex.
Errorwill matchError herebut notErrors here). You can surround a word by wildcards to match partial words (ex.*Error*will matchAnyErrorandAnyErrors) - Search terms are searched in any order (ex.
Hello Worldwill match logs that containHello WorldandWorld Hello) - You can exclude keywords by using
NOTor-(ex.Error NOT ExceptionorError -Exception) - You can use
ANDandORto combine multiple keywords (ex.Error OR Exception) - Exact matches can be done via double quotes (ex.
"Error tests not found")
Time Input
- Time input accepts natural language inputs (ex.
1 hour ago,yesterday,last week) - Specifying a single point in time will result in searching from that point in time up until now.
- Time range will always be converted into the parsed time range upon search for easy debugging of time queries.
- You can highlight a histogram bar to zoom into a specific time range as well.
Property Search
- You can search parsed properties by using
property:value(ex.level:Error,service:app) - You can search for a range of values by using comparison operators (
>,<,>=,<=) (ex.duration:>1000) - You can search for the existence of a property by using
property:*(ex.duration:*)
Properties are parsed out either due to the log message being sent in JSON, or from being part of a span or other default property. Property types are automatically inferred based on the format of the original value (number or string).
Common Useful Properties:
- service (ex.
api), your user-defined service name that emitted the event - level (ex.
error,warn,ok), severity level of the log or span - duration (ex.
777), denoted in ms, populated for spans
Saving Searches
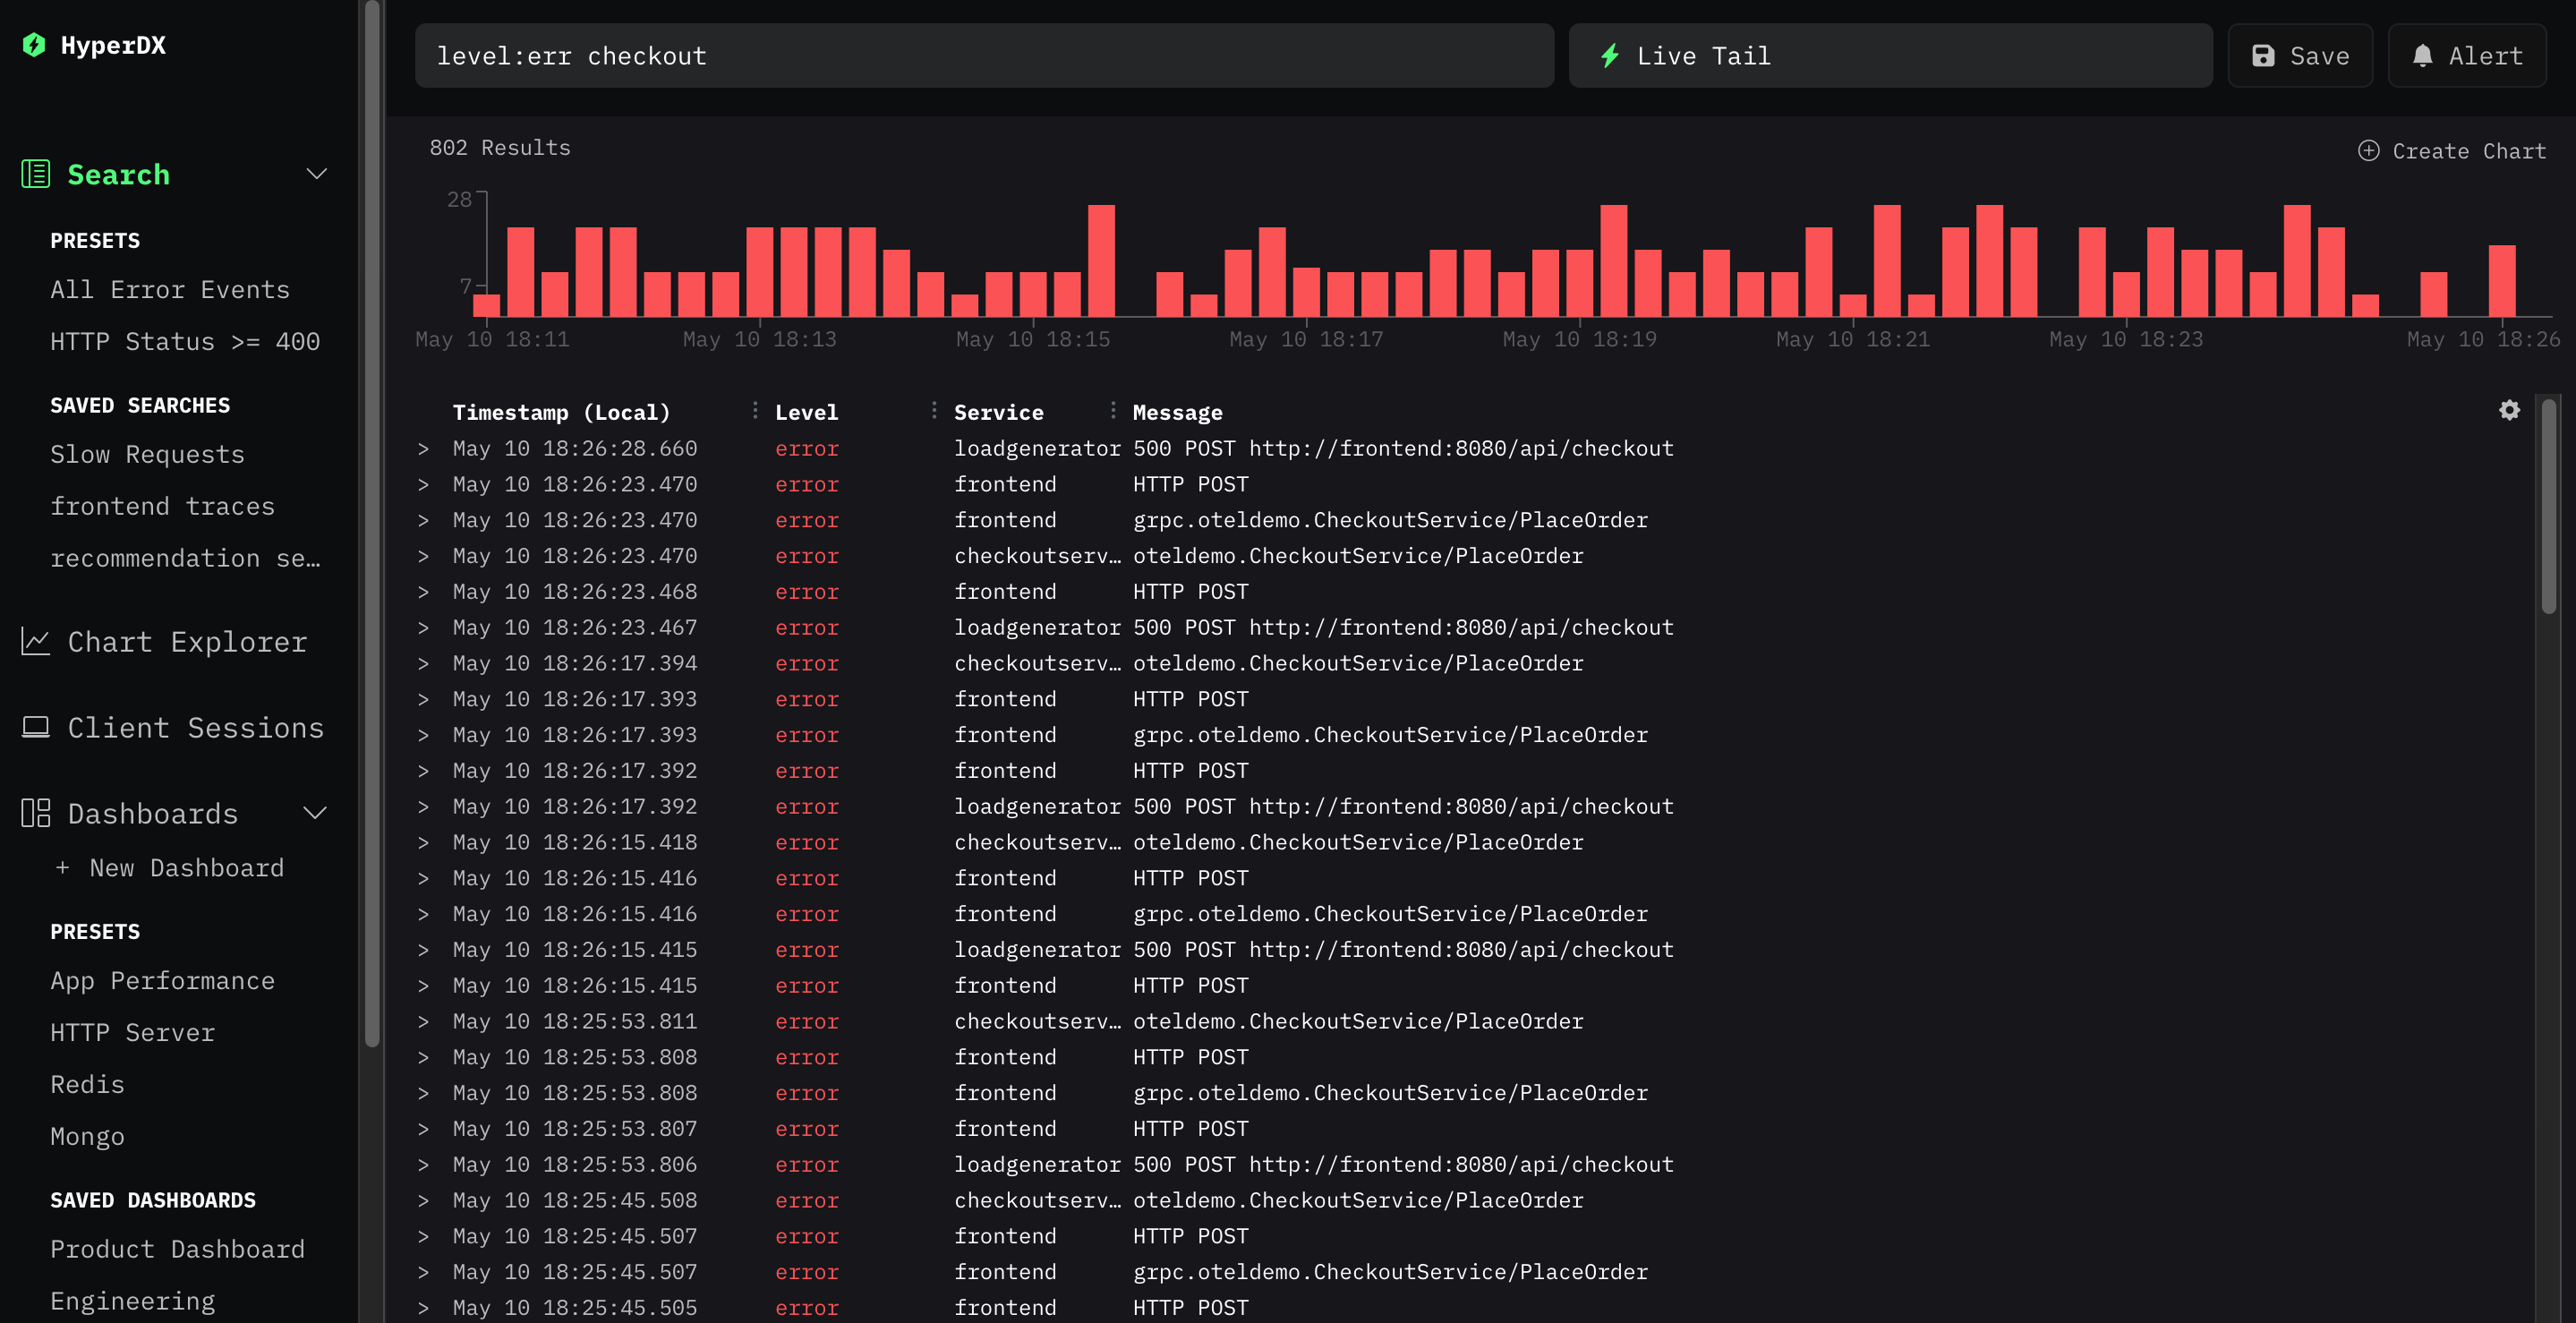
After entering a search, you can save the query by clicking the "Save" button on the top right of the Search page. There you can choose a name for the saved search to easily find it in the nav bar in the future.
